Friday, July 31, 2009

U.S. Trade Deficit Decline Mainly Due to Improved Balance of Trade with 10 Largest Partners

Since U.S. exports and imports both peaked in July 2008, the monthly trade deficit has fallen from $64.891 billion to $25.962 billion (May 2009). That was the lowest monthly trade deficit since November 1999 when the monthly trade deficit stood at $25.745 billion. A further unwinding of the U.S. trade imbalance is likely in the months ahead.

A closer examination of the data reveals that the U.S. trade deficit was not driven sharply lower due to a pickup in U.S. exports. Instead, the data revealed:

• The trade deficit fell sharply because U.S. imports plunged much more rapidly than U.S. exports. Since July 2008, U.S. exports are down 25.0%. Meanwhile, U.S. imports had declined 34.9%.

• Improvement in the trade balance with the nation’s 10 largest trading partners (the ten largest partners in July 2008) accounted for 94% of the decline in the monthly U.S. trade deficit.


• With the 10 largest trading partners, U.S. exports fell 26.3%, while imports declined by 41.1%. Excluding China, with which exports and imports both fell more modestly, exports fell 27.2% and imports plunged 45.4%

• U.S. imports from Venezuela and Saudi Arabia—mainly crude oil—contracted more than 65% on account of reduced U.S. oil consumption and a decline in the price of crude oil. Overall, imports contracted by 40% or more with 5 of the nation’s 10 largest trading partners.


&&

Thursday, July 30, 2009

Fed Beige Book: Economy Possibly Near Its Bottom

The Federal Reserve’s latest Beige Book on current economic conditions by Federal Reserve district, revealed a stabilizing economy. The report noted:

Reports from the 12 Federal Reserve Districts suggest that economic activity continued to be weak going into the summer, but most Districts indicated that the pace of decline has moderated since the last report or that activity has begun to stabilize, albeit at a low level. Five Districts used the words "slow", "subdued", or "weak" to describe activity levels; Chicago and St. Louis reported that the pace of decline appeared to be moderating; and New York, Cleveland, Kansas City, and San Francisco pointed to signs of stabilization. Minneapolis said the District economy had contracted since the last report.

Overall, several themes were set forth in the report’s findings. Those themes included:

• Signs of macroeconomic stabilization are present.

• Economic activity and changes in that activity are uneven across Federal Reserve districts and by economic sector.

• No significant rebound in consumer spending is evident.

• The manufacturing sector is still sputtering.

• The residential real estate market shows signs of stabilizing in numerous districts.

• The commercial real estate sector continues to weaken.

The following table provides a brief summary of developments in the various Federal Reserve districts.


Upcoming releases of the Beige Book on September 9 and October 21 will provide evidence as to whether the current indications of stabilization led to a near-term turnaround in the economy. The latter data will also furnish additional evidence as to the strength of any near-term recovery. For now, weak consumer spending, the possible adverse impact of deteriorating commercial real estate market conditions, and historic experience following the collapse of major real estate asset bubbles hint at a rather sluggish recovery.

&&

Wednesday, July 29, 2009

Latest Data Indicates Housing Prices May Be Stabilizing

For the first time since July 2006, the S&P/Case-Shiller Home Price Index for 20 cities registered an increase. The data for May 2009 showed that home prices rose 0.5%. However, on a seasonally-adjusted basis, home prices continued there slide, albeit a slowing descent. The seasonally-adjusted 20-city index fell 0.2%.

The latest data may be signaling a stabilization of home prices over coming months. For March 2009, just 1 of the 20 cities saw home prices increase. In April, 4 cities experienced price gains. In May, 8 cities registered price gains. In Cleveland and Dallas, home prices rose more than 1%. Cleveland, Dallas, Denver, and Washington, DC have now experienced a rise in home prices for two consecutive months. In Denver, home prices have risen for three consecutive months.

However, some cities continued to experience precipitous declines in home prices. Las Vegas, Miami, and Phoenix all saw home prices fall more than 1%.

bor

In a potentially discouraging note for some of the hardest-hit housing markets, four of the five cities that registered the biggest price declines in May were among those that had seen peak-to-trough declines in excess of 40%. Those cities, along with their home price declines to date, are:

Las Vegas: 53.3%
Los Angeles: 41.4%
Miami: 48.3%
Phoenix: 54.3%

Among the cities benefiting from the biggest monthly home appreciation, just one (San Francisco) had seen a 40% or greater drop in home prices.

That data hints that where the asset bubble was most pronounced, not where home prices have fallen most, could see the slowest recovery in home prices. Instead, a recovery in home prices could commence soonest in regions in which the economy is most resilient and the housing bubble was less pronounced.

In the months ahead, four factors will probably play an important role in shaping any housing recovery that commences:

• Changes in long-term interest rates. The nation’s short-term fiscal situation, namely its ability to continue to finance its enormous stimulus efforts, and changes to its long-term fiscal trajectory could impact long-term rates.

• Rising unemployment. Rising unemployment could dampen consumer confidence and increase risk-aversion toward major purchases, including homes. It could also strain the finances of families with mortgages, leading to increased foreclosures and increased inventory.

• Financial system fragility that inhibits home lending, particularly if the commercial real estate sector experiences a sharpening descent. Already, 15 of the 64 bank failures this year have occurred in states in which cities saw the biggest home price declines in May. Hence, a self-reinforcing relationship between home price trends and bank failures is a possibility.

• Whether an economic recovery takes root or fizzles.

In the near-term, even as home prices are showing signs of stabilization, further declines are still likely. The epicenter of price declines will likely remain California, Arizona, Nevada, and Florida. A recent worsening of the housing situation in the Pacific Northwest may indicate continuing softness there. Afterward, even when the 20-city index bottoms out and begins to rise, regional differences in home price trends could persist for some time.

&&

Tuesday, July 28, 2009

Historical Experience: Standard and Poor's 500 Index Could End 2009 in the 900 to 1,100 range

As U.S. stocks have continued to rise from their March 9, 2009 bottom, a development that typically precedes the end of a recession by 3-6 months, speculation concerning how high stocks might rise by year-end has abounded. Historical evidence from the six most recent recessions suggests that the upside potential could be limited relative to the 982.18 figure at which the S&P 500 closed on Monday.

The following are implied closing figures based on the past six recessions, using the S&P 500’s March 9 closing price of 676.53 as the bottom.

1960-61 Recession: 932.24
1969-70 Recession: 974.23
1980 Recession: 988.95
1981-82 Recession: 1,121.34
1990-91 Recession: 920.41
2001 Recession: 907.94

Mean: 984.69
Median: 972.59

Ultimately, how key factors play out will determine the magnitude and duration of the current recession and its impact on corporate profits in 2009. Some of those factors include:

• The continuing evolution of the economic challenges, likely impacting commercial real estate and consumer credit.
• Long-term deleveraging that reduces the role of the consumer in the overall economy. Currently, real personal consumption expenditures account for just over 70% of GDP. That figure could slowly decline below 70% of GDP in succeeding quarters.
• Impact of rapidly rising U.S. debt levels. If foreign capital inflows slow or even reverse, a currency crisis could unfold.
• Possible geopolitical shocks that could complicate or exacerbate the nation's challenges.

For now, with the economy showing signs of stabilizing, the historic experience suggests that the S&P 500 could end 2009 within 100 points of 1,000 should the recession end in the third or fourth quarter of this year. Such a close would indicate that the sharpest gains in equities prices have already occurred.

&&

Monday, July 27, 2009

U.S. Middle East Talks: Iran Should Be The Priority

The Middle East has been a cauldron for geopolitical stability throughout the duration of the post-World War II era. That region has been gripped by international conflicts, the Cold War rivalry, ethnic and religious rivalries, and terrorism. At the same time, the region remains a vital interest for the United States and of crucial importance to the world at large given its petroleum resources.

Amidst that backdrop, the U.S. has restarted a peace initiative aimed at resolving the historic Israeli-Palestinian dispute. Reuters reported:

The United States launched a fresh drive on Sunday to restart Middle East peace talks, sending senior officials to the region to deal with issues ranging from Jewish settlements to Iran's nuclear ambitions.

The visits by Middle East envoy George Mitchell, Defense Secretary Robert Gates and National Security Adviser Jim Jones were a strong signal from U.S. President Barack Obama of his intention to keep Israeli-Arab peacemaking high on his agenda.


Without question, the historic Israeli-Palestinian dispute has had significant ramifications for Middle East stability. However, a U.S. focus on that dispute might be taking away time and effort that could otherwise be applied toward addressing Iran’s nuclear ambitions through the diplomatic process. It is that latter issue that, if unresolved, could have far-broader and much greater implications for the region and globe at large.

The date at which Iran could develop a nuclear weapons capability is drawing closer with each passing day so long as Iran maintains pursuit of its uranium enrichment activities. A nuclear-armed Iran would dramatically shift the balance of power in the Middle East. It would give Iran a potential capability to shut down Persian Gulf shipping, allowing Iran to place a chokehold on the world’s access to energy were Iran to exercise that capability. It would radically transform the power calculus between the Middle East’s Sunni and Shia Muslims. It would create a potential umbrella by which Iran could aid terrorist organizations ranging from Hezbollah to Hamas with little threat of military consequences for such assistance.

Considering these consequences, a nuclear-armed Iran could potentially mark the end of the existing nuclear non-proliferation framework. In the wake of such a development, the Middle East’s states would need to develop a robust and credible deterrent to Iran’s nuclear capability. Such a deterrent would almost certainly depend on a U.S. nuclear guarantee, as a number of the Persian Gulf states and Israel are geographically tiny. In addition, the need to develop a credible deterrent could give rise to a scramble by numerous states to develop their own nuclear weapons capability. In turn, the spread of nuclear weapons could increase the risk of an accident or miscalculation.

In terms of the historic Arab-Israeli dispute, including that between Israel and the Palestinians, a nuclear-armed Iran could make it “safe” for the more radical elements to exercise a de facto veto. Hence, a nuclear-armed Iran could make resolving the historic dispute, as difficult as it already is, even more challenging.

All in all, the profound consequences of a nuclear Iran, along with the finite time during which a diplomatic solution might be feasible, argues strongly that the priority for U.S. diplomatic efforts should be placed on addressing the challenge posed by Iran’s nuclear program. While it would be prudent for the U.S. to maintain some diplomatic activity on the Israeli-Palestinian front, the Middle East’s challenges require prioritization.

Based on Palestinian President Mahmoud Abbas’ rejection of Prime Minister Olmert’s peace proposal—an initiative that offered even more generous terms than President Clinton’s December 2000 bridging proposal—and unwillingness to cede the demand that Palestinian refugees and their descendents have a “right” to settle in Israel, prospects for a near-term solution on that front are bleak. Hence, the greatest thrust of U.S. diplomacy should be focused where the need is most urgent (the finite time during which Iran can become a nuclear-armed state makes that issue the more urgent matter) and the stakes are highest (no other issue has the broad implications Iran’s acquisition of nuclear weapons would have). In the end, Middle East stability and the prospect for peace rests more on what happens with respect to Tehran than in Jerusalem and Ramallah.

&&

Friday, July 24, 2009

IMF Concludes Its Consultation with China

Earlier this week, the International Monetary Fund (IMF) announced that its Executive Board had completed its consultations with China. The IMF released a summary of the consultation. Key findings included:

• China’s robust fiscal and monetary policy stimuli facilitated an economic recovery. China’s policies have contributed to regional and global economic stability.

• Global economic challenges may make it difficult for the world’s economies to absorb China’s increased production capacity. As a result, the IMF expressed support for China’s measures aimed at boosting domestic consumption spending and reducing China’s reliance on exports.

• China’s low level of public debt should afford the country flexibility in pursuing additional targeted fiscal stimulus measures.

• The IMF called for China to closely monitor its financial system for indications of a decline in credit quality.

• The IMF welcomed China’s intent to participate in its Financial Sector Assessment Program to identify possible areas for financial system reform.

To date, the ongoing discussions in academic and regulatory circles in China concerning the possible deployment of monetary policy to mitigate the risk of an emergent real estate bubble should provide some degree of comfort when it comes to avoiding a serious deterioration in credit quality. Possible monetary tightening would tend to squeeze out marginal borrowers.

Nonetheless, given the limits of monetary policy, regulators will need to carefully watch bank lending for signs that loans are being concentrated disproportionately in any single economic sector such as real estate, down payments are being reduced significantly, or up-front inducements to encourage borrowing are being offered. Should capital inflows pick up dramatically in coming quarters, that situation would also warrant close monitoring, as such inflows could fuel a credit boom that provides access even to marginal borrowers. Those were some of the symptoms of the decay that took place in lending standards during the run-up of the recent U.S. housing bubble.

So far, China’s policy makers appear to have taken to heart a possible role for monetary policy in mitigating the rise of asset bubbles. It remains to be seen how China’s regulators will respond in seeking to preclude any material decline in credit quality, particularly as China’s economy experiences a return of robust growth.

&&

Thursday, July 23, 2009

House Passes Paygo Budget Rules: Major Exemptions and a Key Challenge

Yesterday, the U.S. House of Representatives passed H.R. 2920, which would reinstitute a pay-as-you-go requirement of budget neutrality on new tax and spending legislation, by a 265-166 margin. 241 democrats and 24 republicans voted in favor of the legislation while 13 democrats and 153 republicans voted against the bill. In essence, the legislation would require any new expenditures or tax relief be offset by spending reductions and/or tax increases to maintain overall budget neutrality.

Nonetheless, a significant share of the federal budget would be exempt from the legislation. Exemptions would apply to, among other programs or laws, physician payments made by Medicare, provisions of the Economic Growth and Tax Relief Reconciliation Act of 2001, and the Jobs and Growth Tax Relief and Reconciliation Act of 2003 via scoring (calculating) adjustments. In other words, should Medicare physician payments rocket, no budgetary offsets would be required. At the same time, renewal of expiring provisions associated with the 2001 and 2003 tax relief measures also would not require offsets.

Arguments can be made to rationalize those and other exemptions. For example, allowing the tax relief provisions to expire altogether might prove too economically disruptive, especially at a time when the economy remains weak.

However, on the Medicare front, the exemption is particularly difficult to justify given the long-term fiscal imbalances associated with that program. In that case, the exemption merely serves to postpone the federal government’s starting to tackle the issue of mandatory spending program reforms necessary to put the nation on a more sustainable fiscal path.

Aside from the above-noted exemptions, the first major test of Congressional budgetary resolve could come in the form of health care reform legislation. To date, the Congressional Budget Office (CBO) has estimated that the major legislation likely to be considered would increase the nation’s budget deficits. That raises the question as to whether Congress will make changes to the legislation necessary to make it budget neutral to begin establishing credibility on the fiscal discipline issue or whether Congress will adopt the legislation, even as it would increase the nation’s budget deficits. Considering the exemption put in place for Medicare physician payments, odds probably favor the latter course, though such a course does not ensure that the health care legislation would be adopted. It only suggests that the legislation probably will not be made budget-neutral.

&&

Wednesday, July 22, 2009

Flaws in Heath Care Bill Make Congressional Approval Prior to the August Recess Unlikely

When it comes to major health care reform, credible legislation will need to address the chronic situation at which national health expenditures have been rising faster than nominal GDP. The most recent CBO assessment provides no evidence of mechanisms or approaches that would produce such outcomes. Instead, the costs associated with H.R. 3200 (America’s Affordable Health Choices Act of 2009) would rise an average of 9.4% per year in the 2015-2019 period. That implies a national health environment in which expenditures continue to rise in excess of overall economic growth. In the long-run, such a situation is unsustainable.

Therefore, a closer look at the health expenditures problem is warranted. Since 1990, U.S. health expenditures have grown just over 30% more than the economy has expanded, mainly in two spurts.


Unless the growth in health care expenditures slows relative to overall economic growth, rising health costs will sustain or increase barriers to expanded coverage. At the same time, that development would raise federal health expenditures, particularly those associated with Medicare and Medicaid spending, faster than tax revenue can increase from the nation’s economic growth. In turn, that situation would increase the nation’s budget deficits and undermine its long-term fiscal situation.

Already, Congressional Budget Office (CBO) Director Douglas W. Elmendorf has told the Congress that the U.S. is on an unsustainable fiscal path in which its debt will grow faster than its economy. Rising health expenditures will play a leading role in that development. On July 16, 2009, Elmendorf told the Senate Budget Committee:

Under current law, the federal budget is on an unsustainable path—meaning that the federal debt will continue to grow much faster than the economy over the long run. Although great uncertainty surrounds long-term fiscal projections, rising costs for health care and the aging of the U.S. population will cause federal spending to increase rapidly under any plausible scenario for current law…

CBO projects that if current laws do not change, federal spending on Medicare and Medicaid combined will grow from roughly 5 percent of GDP today to almost 10 percent by 2035 and to more than 17 percent by 2080. That projection means that in 2080, without changes in policy, the federal government would be spending almost as much as a share of the economy, on just its two major health care programs as it has spent on all of its programs and services in recent years…

The large amounts of federal debt that would accumulate under each of CBO’s long-term budget scenarios imply that the government would have to spend increasing amounts to pay interest on that debt. The growth of debt would lead to a vicious cycle in which the government had to issue ever-larger amounts of debt in order to pay ever-higher interest charges. Eventually, the government would need to adopt some offsetting measures—such as cutting spending or increasing taxes—to break the cycle and put the federal budget on a sustainable path.


Therefore, while a popular fallacy has it that overall growth in health expenditures is largely a matter of consumer choice and, therefore, is not necessarily a bad thing, that assessment is a fundamental misdiagnosis of the situation.

In fact, it is little different from the notions advanced by those who championed increased access to mortgages, even as the nation’s housing bubble moved toward its crest. A persistent situation in which health expenditures increase at a rate faster than economic growth is a dangerous economic imbalance. Income from economic growth must be sufficient to pay for health expenditures. Therefore, maintaining a situation in which health expenditures rise faster than the economy grows is unsustainable in the long-run.

Such a situation would require foreign capital inflows to make up the difference. It is unlikely that foreigners would readily finance what would amount to a health expenditures bubble so to speak. Far from offering foreigners attractive returns on investment, such a situation would put the U.S at increased financial risk. Such increased risk would lead foreigners to demand higher returns to compensate them for assuming that risk. As a result, long-term interest rates in the U.S. would rise. Rising long-term rates would impede economic growth, leading to an even larger imbalance were health expenditures to continue to rise.

Ultimately, such a situation would end badly for the U.S. At some point, the U.S. fiscal risks would be too great and foreign capital inflows would cease or reverse. Confronted by such a situation, the U.S. would need to make wrenching policy choices, many of which would be bad. Crippling tax hikes that would suppress economic activity could be levied. Medicare could suddenly be transformed into a means-tested program, leaving a significant share of senior citizens to find alternatives that might not exist at the time. The federal government could create a health care office modeled after the World War II-era Office of Pricing Administration. That Office’s price controls would create shortages and major distortions in the health care sector. In desperate fiscal straits, the federal government could enact a law requiring the Federal Reserve to purchase long-term Treasury securities at a fixed low-interest rate or it could even partially default on its debt via its deliberately encouraging inflation.

Recent polling data suggests that Americans increasingly understand the need to address the health expenditures problem. A July 9-13, 2009 Ipsos/McClatchey poll found that if Americans had to choose between expanded coverage and cost restraint as their top priority, 44% chose reining in rising health costs. In a July 10-12, 2009 USA Today/Gallup poll, 52% selected curtailing rising costs.

In coming weeks, public pressure on account of the legislation’s failure to address the health expenditures issue, as well as its increasing the nation’s debt by $239 billion in the 2010-2019 timeframe, will likely lead Congress to slow down the consideration process. It is unlikely that Congress will approve such legislation before its August recess on account of its flaws and public concerns about rising health costs and the legislation’s budget impact. It is plausible that Congress may not pass such legislation at all this year.

&&

Tuesday, July 21, 2009

Policy Makers Need to Keep in Mind the Law of Unintended Consequences

The law of unintended consequences dictates that the deliberate decisions, choices, or actions of people, business, or government can lead to unanticipated or unintended consequences. In other words, although the purpose of a decision, choice, or action might be beneficial, that decision, choice, or action could have unanticipated effects—benign or adverse—that have little to do with the original intent behind that decision, choice, or action.

Such outcomes are possible because people lack prescience. No person, institution, or technology offers a crystal clear window to the future. Aside from natural phenomena, human behavior and interactions are so complex that the possible range of future effects of a given decision, choice, or action are all but infinite. As a result, a range of future effects is both unknown and unknowable.

Recent examples abound.

On March 30, 2009, The New York Times reported:

Amid the shaky economy of the last couple of years, housing has emerged as the central pillar of support. The market for housing has become less volatile and less prone to oversupply than before; it has also become the Federal Reserve's main lever for reviving the economy…

Housing prices have been increasing faster than general inflation for several years, and they have accelerated in recent months to their fastest real rate of gain in decades.

All this has bolstered consumer spending and helped salve the wounds that the falling stock market inflicted on households.


On July 20, 2009, The Washington Post reported:

The chemicals, called hydrofluorocarbons (HFCs), were introduced widely in the 1990s to replace ozone-depleting gases used in air conditioners, refrigerators and insulating foam.

They worked: The earth's protective shield seems to be recovering.
But researchers say what's good for ozone is bad for climate change. In the atmosphere, these replacement chemicals act like "super" greenhouse gases, with a heat-trapping power that can be 4,470 times that of carbon dioxide.


In both examples, the benefits seemed clear. The downside risks appeared to be limited, if they existed at all. Yet, housing proved to be no “Rock of Gibraltar” in the medium-term, as a giant bubble developed and burst, creating severe global synchronized recessions. In the latter case, addressing one environmental problem created a potential hazard for addressing another.

The law of unintended consequences is particularly relevant today. In the wake of unprecedented monetary and fiscal policy stimulus, policy makers need to be looking ahead to the future and developing scenarios for at least some of the possible unintended consequences that might arise. Given the enormous scope of policy decisions, the exercise needs to be particularly robust.

Possible unintended consequences include, but are not limited to:

• A return of reckless decision making on account of moral hazard resulting from bailouts and other extraordinary government assistance.

• The impact of increased market concentration that results from the failure of small financial services firms at a time when the federal government has acted as a guarantor for those that were deemed “too big to fail.” Amplification of such a risk should the federal government fail to develop an adequate regulatory response to the “too big to fail” issue.

• Political goals crowding out business objectives for firms that had received massive federal aid.

• A shift in investor sentiments concerning U.S. Government debt on account of a combination of increased debt from the fiscal stimulus and possible health care reform legislation should that legislation lack budget neutrality and fail to address the persistent growth of health expenditures in excess of nominal GDP, which amounts to a long-term expenditures bubble so to speak.

• A reappearance of excessive inflation from a delayed scaling back of the fiscal and monetary policy stimulus or the onset of a second recession from the premature or overly aggressive scaling back of the stimulus.

• A fundamental shift in risk perceptions that could lead to the emergence of a future housing bubble should the federal government make mortgage payments for unemployed homeowners.

• A slowing of the long-term economic growth trajectory should the federal government rely too heavily on tax hikes to fund new programs, finance existing mandatory spending programs without major reforms, or try to reduce its annual budget deficits.

• The impact on public- and private-sector finances and investment should long-term interest rates embark on a secular rise.

• The overall impact on economic growth, market risks, and innovation should the federal government’s post-financial crisis regulatory reforms result in excessive or inadequate regulation.

• A shift in investor sentiments concerning the U.S. dollar resulting from current and expected policy moves, economic outcomes, and a long-term diminishing of the dollar’s role as a world reserve currency.

• The fiscal and monetary policy proves sufficiently successful to bolster public confidence in government’s role of addressing economic crises that a new burst of economic euphoria unfolds.

It will be important that policy makers have a contingency plan for each of these scenarios, among others. In addition, the contingency plans will need to be sufficiently robust to lay out possible consequences of those measures, possible antidotes for those consequences, and contingency measures for those antidotes, as well.

In the post-housing bubble years, the law of unintended consequences is especially relevant given the magnitude of policy measures that have been undertaken and are likely to be pursued in the near-term. Although some risks are unknown or unknowable, it is imperative that policy makers take a rigorous approach toward identifying and addressing major risks in a proactive fashion. Neglect of this essential responsibility could have particularly high costs, especially when long-term economic and geopolitical trends are added to the mix.

&&

Monday, July 20, 2009

China Regulator Sounds Off on Real Estate Lending

Less than two weeks after a leading Chinese academic suggested that China’s central bank should signal its commitment to a stable monetary policy so as to help prevent the development of possible asset bubbles, a Chinese regulator expressed concern about increasing indications of overheated bank lending to the real estate sector.

On Sunday, CNBC reported:

China's top banking regulator on Sunday warned of the risks from surging bank lending, singling out the dangers of unhealthy growth in the property market.

"(We) must control the risk of real estate loans," said Liu Mingkang, the head of the China Banking Regulatory Commission, adding that measures must be taken to better evaluate the creditworthiness of borrowers.


The growing concern in China about the potential risk of a possible real estate bubble, probably one or more regional bubbles, is well-founded.

• Banking crises have often been preceded by credit booms. An IMF Working Paper written by Luc Laeven ad Fabian Valencia found that credit booms preceded about 30% of banking crises.

• Real estate busts in which the prices of homes, farms, and/or commercial property fell have often led to waves of bank failures.

• Research has shown that shifts in capital flows from earlier asset bubbles can contribute to the rise of asset bubbles elsewhere. Hence, with the U.S. housing bubble having burst in recent years, some capital in search of appreciation could flow to a growing economy and rapidly rising asset markets in China.

• According to research by the International Monetary Fund, housing busts typically lead to recessions that are twice as deep and twice as long as those associated with equities busts.

• Considering the still fragile shape of economies in parts of Asia, Europe, and the Americas, including financial system fragility in some of those locations, the rise and fall of a real estate bubble in China could send the kind of fresh shock rippling through the global financial system that could suffocate any economic recovery that might be underway in various Asian, European, and North and South American economies at that time. During the Great Depression, a relentless wave of economic shocks rolled across the European and American economies inhibiting any early recovery.

• Should an asset bubble burst in China, its fallout could sufficiently damage already-weak financial institutions in numerous major money centers so as to lead to a prolonged impairment of the credit creation process. Such a development would have the potential to lead to a prolonged period of regional or global economic stagnation.

• In China, a significant real estate bubble could undermine domestic economic growth and job creation. Those developments could lead to a further intensification of forces contributing to recent ethnic strife in parts of China.

All said, China has ample reason to be concerned about the possible rise of a major regional housing bubble or bubbles. Given the stakes involved, China might well choose to break new monetary policy ground in attempting to deploy monetary policy toward reducing the risk of the emergence of a real estate bubble.

&&

Friday, July 17, 2009

Verleger Prediction of $20 Oil Later This Year Is Highly Unlikely To Verify

On Thursday, Bloomberg.com reported that oil market analyst Philip Verleger predicted that the price of crude oil would fall to $20 per barrel later this year. If the price of crude oil were to drop that low, it would mark the lowest price since February 7, 2002 when crude oil ended trading at $19.64 per barrel.

A closer examination of historic data and underlying fundamentals suggests that a scenario of $20 per barrel oil later this year has little chance at verifying. Although the price of crude oil reached $72.68 per barrel on June 11 before falling just over 18% to $59.52 per barrel on July 14, that recent sharp decline does not presage an imminent crash in oil prices.

• Over the past quarter-century, once the price of crude oil had risen 15% or more above the price at which it had first fallen 40% or more on a year-to-year basis, that outcome was a strong signal that the market bottom had already been reached. Since 1983, there were four occasions on which the market provided such a signal. Over the following 8 months from the date at which the price of crude oil met that recovery threshold, the price of oil remained 40% or more above the bottom that had previously been reached.


During the four previous signals, the price of crude oil ranged from as low as 132.7% of the bottom price to as high as 232.00% of the bottom price during the 8 months following the signal. The low price achieved following the signal had less fluctuation than the overall range, varying from 132.2% to 145.5% of the bottom price.

Assuming that the $33.87 per barrel price that was reached on December 19, 2008 winds up being the bottom—as is strongly suggested by the quarter-century historical experience—and the earlier historic data is representative, that would imply that the price of crude oil would range from as low as $44.93 per barrel to as high $78.58 per barrel in the May 28, 2009-January 28, 2010 timeframe. To date, the price of crude oil has closed as low as $59.52 per barrel (July 14) and as high as $72.68 per barrel (June 11) during the opening part of that period.

• Global crude oil stocks had been rising but could avert dangerous levels. Global stocks had risen 10.4 million barrels in April to levels that were 7.5% above the comparable 2008 figure. However, according to data from the U.S. Energy Information Administration’s Weekly Petroleum Status Report, U.S. crude oil stocks had increased by almost 16 million barrels during that timeframe. In other words, U.S. stocks had played a disproportionate role in leading global stocks higher. Since then, U.S. oil inventories have peaked and begun to fall. As of the four-week period ending July 10, 2009, U.S. crude oil stocks had fallen nearly 30 million barrels from their peak during the same period ended May 1.

That trend could continue until early- to mid-September. Typically, as summer driving season concludes, U.S. inventories begin to increase until heating season sets in during the late-November to early-December period.


During the 2006-2008 timeframe, U.S. oil inventories rose about 1.2 million barrels per week until heating oil season commenced. During the extreme financial market turmoil last autumn, U.S. oil consumption fell sharply and U.S. crude oil stocks rose by about 2.8 million barrels per week. That kind of increase in oil inventories that sent the price of crude oil crashing 76.7% from a high of $145.29 to $33.87 in a matter of months is not likely, as the latest macroeconomic data suggests that a number of major economies are stabilizing. A few, including China, have begun to experience more robust growth, with the Chinese economy expanding 7.9% on a year-to-year basis from a large fiscal stimulus and an extraordinary monetary policy stimulus. That latter stimulus, if it is reeled in, could touch off the development of asset bubbles. Already, the Shanghai Composite has risen 75% this year. But that development is not likely to impact China’s growth very near-term.

Stabilization of the U.S. economy and a return of growth for the U.S. economy and some major international economies over the coming months should begin to pare product inventories (gasoline, distillate fuel, etc.), as well as lead to a gradual increase in global crude oil demand. In its July 2009 report, OPEC estimates that global crude oil demand will rise from 82.80 million barrels per day in the Second Quarter to 84.84 million barrels per day in the Fourth Quarter. If that scenario begins to play out, an abnormally sharp rebound in U.S. crude oil stocks and a rise of global inventories to dangerous levels will become less likely. In other words, the kind of crippling oil glut that could cause a crash in oil prices would become unlikely.

On the supply-side, OPEC is likely to remain risk-averse through much or all of the remainder of this year. So long as U.S. consumption, which has recently flat-lined in the 18.0 million to 18.5 million barrels per day range since mid-spring, down 8%-12% from 2007- and 2008-level consumption, OPEC is likely to remain cautious about increasing production.


Moreover, considering that OPEC continues to monitor global crude oil stocks, and had even used such stocks as a yardstick in setting production quotas in the recent past when oil prices were rocketing toward their July 2007 peak, OPEC is likely to err on the side of caution in restraining its member country production. Its restraint to some recent calls for an increase in oil production after oil prices had doubled from their December 2008 low underscores OPEC’s caution.

As a result, OPEC is not likely to increase its oil production through much or all of the rest of this year, even as demand gradually increases. That production posture should help mitigate the risk of the kind of enormous oil glut necessary to bring about a fresh collapse in the price of crude oil.

In the end, if the Verleger scenario is to pan out, the world would need to witness a significant new regional or global shock that would erase the recent trend toward economic stabilization and set off another dramatic economic contraction on a global basis. While scenarios such as a collapse of Eastern Europe’s banking system could trigger such an outcome, such scenarios are not assured.

Conclusion:

Historical experience, underlying macroeconomic dynamics, and OPEC’s restraint indicate that the price of crude oil is unlikely to collapse to $20 per barrel later this year. Instead, a possible mini-bottom in the $40 per barrel to $50 per barrel range during price fluctuations is far more plausible through the remainder of this year.

&&

Thursday, July 16, 2009

No Bailout of CIT Group; At Least For Now

Yesterday, CNN reported:

Cash-starved small business lender CIT Group said Wednesday evening that it has been told it won't be getting a government bailout anytime soon.

There is "no appreciable likelihood of additional government support being provided over the near term," the company said in statement. The CIT board and executives are evaluating alternatives.


In the preceding days, there had been discussions between the federal government and CIT concerning a fresh round of federal assistance for the troubled small business lender. Had assistance been rendered, it would have stretched the federal government’s “too big to fail” doctrine beyond its implied purpose of preventing events for which the fallout could lead to the failure of the nation’s financial system. Instead, such a decision would have indicated that the “too big to fail” doctrine, already laden with moral hazard, had evolved into one in which it is politically unpalatable to allow even smaller entities to fail. Then, political connections, not the size of the firm or the risk it posed, would become the arbiter of whether a firm’s survival would essentially be guaranteed by the federal government. Such an outcome would further erode market discipline.

CIT Group is much smaller than the financial firms that were propped up by massive federal assistance. In its March 31, 2009 quarterly balance sheet, CIT reported $75.7 billion in assets. In contrast, assets held by Citigroup amounted to $1.9 trillion at the end of last year. Bank of America had assets of $1.8 trillion, and AIG’s assets amounted to $860.4 billion. Simply put CIT Group was nowhere near the class of firms that posed systemic risk.

Furthermore, were CIT’s to fail, it would not become the largest failed financial institution. When Washington Mutual Bank was shut down by the FDIC, it held assets of $307 billion. Additional banks with assets of $10 billion or more that were closed down were IndyMac, Downey Savings & Loan, and BankUnited Federal Savings Bank.

Rather than stretching the “too big to fail doctrine” into a de facto policy that exacerbates moral hazard, two viable alternatives exist:

• The FDIC could close down CIT Group and use its normal resolution process to dispense of CIT’s assets. CIT had previously registered as a bank holding company.

• The federal government could leave CIT to find such financing that it needs from private sources. Failing that, it could leave CIT to file for bankruptcy. Considering the FDIC’s need to conserve cash for the additional bank failures that are likely in coming months, the second option of leaving CIT to file for bankruptcy is probably the more attractive choice.

Either course would indicate to wary taxpayers that the federal government will not provide assistance to firms that are not too large to fail. Instead, extraordinary federal assistance would be confined to those entities that pose systemic risk. That, in turn, would limit the probability of the development of more widespread excessive risktaking in the future based on expected federal bailouts to preclude firm failure. Currently, moral hazard elevates the risk of such practices on account of a de facto federal guarantee that has been affirmed and reaffirmed for firms that pose systemic risk since the 1970s.

&&

Wednesday, July 15, 2009

Automotive Prices Lead Core Producer Price Index Higher

During June, headline producer prices surged 1.8%. Excluding the typically volatile food and energy components, the producer price index rose at a tamer, but still brisk 0.5%. Leading this rise was a climb in producer prices for light trucks and passenger cars.

The Bureau of Labor Statistics explained:

The index for finished goods other than foods and energy increased 0.5 percent in June after inching down 0.1 percent in May. Accounting for most of this upturn, prices for light motor trucks climbed 3.4 percent following no change in the previous month, and the index for passenger cars rose 2.0 percent in June after edging up 0.1 percent in May.

At this time, it remains to be seen if a trend in which new vehicle production costs rise faster than core producer prices becomes established. The fact that monthly producer prices for passenger cars have increased faster than core producer prices for 5 of the last 7 months and producer prices for light trucks have exceeded the change in core producer prices in 6 of the last 7 months is a worrisome indicator. A six-month moving average for the core producer price index and the two new vehicle components also indicates that costs in the automotive sector may be starting to rise faster than overall producer prices.


A trend in which automotive producer prices rise persistently faster than the core producer price index could indicate that the restructuring of the automotive industry, including the bankruptcies of Chrysler and General Motors, is slow in increasing competitiveness even as the debt burdens of Chrysler and General Motors have been pared substantially.

Should the automotive sector grow less cost-competitive in its production costs, the automotive sector could be confronted with the challenge of trying to pass on its higher costs to consumers or continuing to face financial pressure. Already, the six-month moving average of new vehicle prices indicates that new vehicle prices are rising faster than either headline or core consumer prices.


Although it is too soon to determine whether that trend will be sustained, much less fully diagnose its causes, at least three factors could be contributing to the possible emergence of an unfavorable trend in new vehicle prices.

• Automobile manufacturers are trying to “catch up” with the recent increase in their production costs relative to producer prices. In doing so, they are trying to pass on at least a share of those costs to consumers.

• Automobile manufacturers have assumed that demand for new vehicles will increase as an economic recovery takes hold. Under such a scenario, they figure that there might be an opportunity to pass on at least some share of the recent increase in their production costs that would not exist were the economy to continue to contract.

• Moral hazard is beginning to play out. Given the enormous taxpayer assistance that has been provided to the automotive industry and to automotive parts suppliers, the industry believes that additional downside risks from a stagnating of new vehicle sales or even a further decline are relatively minimal. Instead, the federal government would be prepared to render additional assistance under such a scenario. Under such a risk assessment, the automotive producers could assume that they can take a greater risk at increasing their prices in the face of soft economic conditions that they might otherwise have had to forego in the absence of expected additional federal assistance.

Overall, a situation in which the automotive industry’s production costs rise relative to the core producer price index could have profound consequences for the troubled U.S. automobile industry. In a market in which competition is global, more cost-competitive foreign producers could gain additional market share. That development could weaken recovery prospects for the U.S. automobile industry. It could also inhibit the domestic industry’s ability to invest in research and development relative to their international competitors, potentially creating an environment of further decline relative to global producers. It could render the U.S. automotive industry less capable of addressing potential future challenges brought on by the emergence of disruptive technologies that could dramatically alter the industry landscape in terms of such variables as cost, design, and fuel consumption.

&&

Tuesday, July 14, 2009

June Monthly Treasury Statement: Fiscal Year-To-Date Deficit Exceeds $1T

Yesterday, the Department of Treasury released its monthly treasury statement for June. The publication showed that the reported federal budget deficit for Fiscal Year 2009 had exceeded $1 trillion, reaching $1.086 trillion. In addition, monthly revenue was down 17.1% from June 2008 and 22.1% from June 2007.

This is the first issue of the monthly treasury statement to indicate a $1 trillion deficit. Broader measures show an even worse fiscal deterioration. Recent data for changes in total public debt outstanding are:

FY 2006: $574.3 billion (reported deficit: $248.2 billion)
FY 2007: $500.7 billion (reported deficit: $162.8 billion)
FY 2008: $1,017.1 billion (reported deficit: $454.8 billion)
FY 2009: $1,520.6 billion (reported deficit: $1,086.3 billion)

The steep decline in federal revenue is consistent with recession-driven outcomes. However, its magnitude is much larger than occurred during the two most recent recessions. During the previous two recessions, monthly federal revenue fell $7.2 billion from June 1990 to June 1991 and $32.2 billion from June 2000 to June 2002. Since June 2007, monthly federal revenue has fallen $61.1 billion. That has put monthly federal revenue well below the trend line since 1990.


In a policy effort to provide economic stimulus, federal expenditures continue to increase. Should some of the increased federal spending be transformed into permanent programs or should significant new programs be adopted that are not budget-neutral, those developments could add to the nation’s structural budget deficits.

Over the medium-and longer-term, increased structural deficits could undermine the U.S. fiscal position. Should private investors and foreign holders of U.S. debt instruments, who hold a combined 75% of gross public debt become concerned about the nation’s long-term fiscal situation, that development could lead to higher long-term interest rates. Increased long-term interest rates would suppress the nation’s long-term growth trajectory, reducing tax revenue below figures that would otherwise prevail, increase debt servicing costs for the federal government, and make it more difficult for the federal government to finance all of the programs it seeks to fund, possibly leading to difficult trade-off choices.

On account of those risks, it will be important for policymakers to think beyond the current recession. A medium-term fiscal strategy will need to entail a sufficient withdrawal of temporary stimulus, as well as credible measures aimed at addressing the nation’s structural budget challenges. In the meantime, policymakers should seek to “do no harm” in applying strict budget neutrality to any permanent programs they might seek to adopt.

&&

Monday, July 13, 2009

Survey Predicts 3.0% Inflation in Next 12 Months, But Actual Inflation Could Be Less

From May 2008 to May 2009, the consumer price index fell 1.0%. That was the biggest 12-month decline since consumer prices fell by 1.1% in the April 1949-May 1950 timeframe.


However, if the latest consumer expectations for inflation are correct, inflation would revive from its slumber over the next 12 months. The latest Reuters/University of Michigan survey predicted that consumer prices will rise 3.0% over the next year.

This latest prediction offers a good opportunity to take a closer look at inflation predictions. Based on the 12-month inflation predictions made in the University of Michigan survey cited above from May 1978 through May 2008, one finds:

• A median predicted inflation rate was 3.1% vs. the median inflation rate that prevailed of 3.2%

• The predictions were tightly clustered in the 2.5%-4.9% range. Nearly 81% of predictions fell in that range. Inflation during the prediction period fell in that range just under 60% of the time. The predictions typically avoided the long-tails (changes in consumer prices of less than 0% and those of 10% or more). Just 1.4% of predictions fell in that area. Actual inflation outcomes fell in those areas 9.6% of the time.


• There was a mean forecast error of 1.2% with a standard deviation of that error of 1.2%. In other words, the magnitude of the forecast error was quite volatile. The smallest mean forecasting errors occured in the 2.5%-4.9% forecast range. Then, the mean error was 0.9%. That conditon is not too surprising given that inflation fell in that range about 60% of the time, while forecasts called for such inflation around 80% of the time. However, when the inflation approached or reached the tails, the mean forecast error rose. Given the present macroeconomic environment, it should be noted that when consumer prices fell, the mean forecast error was 4.7% and when inflation was in the 0%-2.4% range, the average forecast error was 1.2%. Increased forecasting errors also occured during times of elevated inflation.

• In general, the higher the predicted inflation rate, the greater the error. The exception concerned predictions of 10% or greater inflation. A plausible reason for that outcome is that consumers were very reluctant to forecast 10% or greater inflation until such inflation had become established. Consumers forecast 10% or greater inflation just 1.4% of the time. Consumers were also reluctant to expect a continuation of such inflation. 10% or greater inflation occurred 8.2% of the time. The 12-month inflation rate reached 10% in March 1979. Consumers made their first forecast for the 12-month inflation rate to average 10% or above in November 1979. Their last such forecast was made in April 1980. The last double-digit 12-month inflation figure was recorded 6 months after consumers last expected it.

What All This Means:

Comparisons of 12-month inflation predictions and 12-month inflation outcomes provide some general lessons concerning human forecasting. Those lessons include: (1) Forecasts focus in a tight range, namely ranges that are familiar to those making such predictions. That is why tail risk-type events such as major crises are typically foreseen by only a few; (2) During times abnormally high inflation or abnormally low inflation/deflation, forecasting errors are large; and, (3) People view economic phenomena as more stable than such phenomena actually are.

Those general lessons also have specific ramifications for the 3.0% inflation forecast. Adding the prevailing economic dynamics (household deleveraging, an rise in saving as a share of disposable personal income, a weak economy, tighter credit markets, and the loss of the earlier “wealth effect” from high stock and real estate prices that helped encourage consumption) to the general lessons from the inflation prediction experience, odds favor an inflation rate of less than 3% for the 12-month period ending in July 2010. Given the average error associated with various inflation outcomes, it is probably more likely that inflation will amount to 1%-2% over the next 12 months rather than 3%, barring some significant geopolitical shock that disrupts the energy markets for an extended period of time and/or much more robust economic growth than expected develops.

&&

Friday, July 10, 2009

Is the U.S. in the Midst of a “Lost Decade” for Stocks?

Typically, U.S. stocks bottom out 3-6 months before the end of a recession and they return to their pre-recession highs, on average, about 3.7 years after having reached that high. The experience following U.S. recessions since 1950 is as follows:

• July 1953-May 1954 recession: Pre-recession peak: 293.79, January 5, 1953; First close at or above that level: 294.03, February 4, 1954; Interval: 1 year, 30 days (395 days).

• August 1957-April 1958 recession: Pre-recession peak: 521.05, April 6, 1956; First close at or above that level: 523.40, September 15, 1958; Interval: 2 years, 5 months, 9 days (892 days).

• April 1960-February 1961 recession: Pre-recession peak: 685.47, January 5, 1960; First close at or above that level: 692.06, April 10, 1961; Interval: 1 year, 3 months, 5 days (461 days).

• December 1969-January 1970 recession: Pre-recession peak: 985.21, December 3, 1968; First close at or above that level: 988.26, November 9, 1972; Interval: 3 years, 11 months, 6 days (1,437 days).

• November 1973-March 1975 recession: Pre-recession peak: 1,051.70, January 11, 1973; First close at or above that level: 1,065.49, November 3, 1982; Interval: 9 years, 9 months, 23 days (3,583 days); Two oil price shocks, an extended period of high inflation, and two recessions (January-July 1980 and July 1981-November 1982) occurred during that nearly 10-year interval.

• July 1990-November 1991 recession: Pre-recession peak: 2,999.75, July 17, 1990; First close at or above that level: 3,004.46, April 17, 1991; Interval: 9 months (274 days).

• March 2001-November 2001 recession: Pre-recession peak: 11,722.98, January 14, 2000; First close at or above that level: 11,727.34, October 3, 2006; Interval: 6 years, 8 months, 19 days (2,454 days); The dot-com bubble burst, the federal government saw budget surpluses that emerged during the late 1990s give way to renewed significant budget deficits, and the September 11, 2001 terrorist attacks occurred during that nearly 7-year interval.

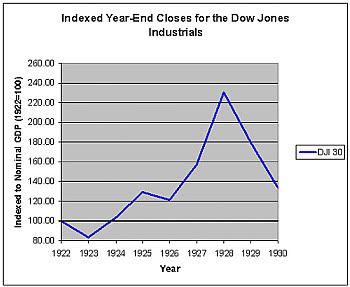
However, in the earlier experience, there have been two occasions during which the Dow Jones Industrials failed to reach its pre-recession peak for 10 years or longer. Those seminal economic events were the Panic of 1907 that produced a credit crunch and severe recession in which real GDP fell 10.8% and the Great Depression during which real GDP contracted by 26.5% in the 1929-33 timeframe. In addition, following the collapse of Japan’s twin stock market and real estate bubbles, its Nikkei 225 Index has remained much below its December 1989 top for more than 19 years.

The Panic of 1907: The Dow Jones Industrials closed at 103.00 on January 19, 1906. The Dow Jones Industrials did not return to that level until it closed at 103.11 on September 28, 1916, an interval of 10 years, 8 months, and 9 days (3,905 days).

The Great Depression: The Dow Jones Industrials closed at 381.17 on September 3, 1929. The Dow Jones Industrials did not return to that level until it closed at 382.74 on November 23, 1954, an interval of 25 years, 2 months, and 2 days (9,212 days).

Japan’s “Lost Decade” of the 1990s-2000s: The Nikkei 225 Index closed at 38,915.87 on December 29, 1989. Through July 10, 2009, the Nikkei has failed to return to that level. That is an interval of 19 years, 6 months, and 11 days (7,133 days). Its last closing price was 9,287.28 on July 10, a figure that is 76% below its December 1989 crest.

In terms of the ongoing “Great Recession” in the United States, the Dow Jones Industrials peaked at 14,164.53 on October 9, 2007. On July 9, the Dow Jones Industrials closed at 8,183.17, which is 42% below its pre-recession peak.

Four possible scenarios could result in the Dow Jones Industrials taking a decade or longer to return to its pre-recession peak:

• In the absence of visible signs of economic recovery, federal policy failures, and a generally unrelenting bear market that turns aside repeated rally attempts, investors could make fundamental changes in their perceptions of risk concerning equities. That development would lead to a long-term reduction in demand for stocks.

• The economic recovery from the current severe recession would be fairly brief. Perhaps, a double-dip recession scenario would unfold. At the same time, on account of a fragile financial system that takes time to heal and increased leverage that needs to be worked off by households, recessions could grow more frequent in succeeding years. During the pre-World War II era (1857 through 1945), the median duration of economic expansions was 22 months and the mean length was 29 months. During the post-World War II period, those figures more than doubled to 45 and 58 months respectively. There is no assurance that the post-World War II experience of notably longer business expansions will persist.

• The U.S. could still experience a systemic financial crisis that severely damages its financial institutions, the development and onset of deflation from a premature withdrawal of fiscal and monetary stimulus, or a currency crisis should it encounter difficulty raising funds to support its economic stimulus efforts and underwrite possible new programs.

• A major geopolitical shock or shocks that have a substantial adverse impact on the U.S. and international economies. Such shocks could include, but would not be limited to the outbreak of conflict in a geopolitically crucial part of the world, the collapse of a government and radical changes in policy in a nation whose economy is intensely interconnected with the world’s major economies, a catastrophic natural disaster that devastates a globally-important financial center.

Conclusion:
Given the past experience following the severe 1973-75 recession, the collapse of the dot-com bubble, there is a reasonably likely prospect that the Dow Jones Industrials may not return to its pre-recession high of 14,164.53 until late in 2014 or beyond. The effectiveness of ongoing political efforts to shore up the nation's banking system and revive the economy and whether or not there are additional significant economic and geopolitical shocks will be critical in influencing the timing of a stock market recovery. Should those efforts fail to produce the desired impact, or worse, should they result in consequences that adversely impact or disrupt the nation’s growth trajectory, there is a genuine possibility that the Dow might not return to that level for a decade or longer after its October 9, 2007 record close.

&&

Thursday, July 9, 2009

Euro-S&P 500 Relationship Is Weak

In making the case for a possible summertime S&P 500 rally to 1,000, an analyst cited a recently strong correlation between movements in the Euro and the S&P 500. CNBC reported:

The recent rally in the euro is a positive sign for the S&P 500, because it shows appetite for risk is still strong and the S&P could hit 1,000 this summer, Kevin Cook, market analyst at PEAK6 Investments, told CNBC Wednesday.

"The positive correlation here between the S&P 500 and the euro has been unbelievable in the past three quarters," Cook, who is also a technical analyst, told "Worldwide Exchange".


As is frequently the case in the realm of finance, seemingly strong relationships can be temporary in nature. In fact, that is the case between the Euro and the S&P 500. Over a longer period of time, the correlation all but completely disintegrates.


The relationship breaks down because the U.S. economy is not disproportionately dependent on U.S.-European Union trade. As a result, the apparently strong relationship between the U.S. Dollar-Euro foreign exchange and S&P 500 is not an enduring feature of the financial landscape.

The recent “unbelievable” correlation between the Euro and S&P 500 was likely produced by special but temporary circumstances. The rapid escalation and then gradual waning of the global financial crisis probably created the seemingly intense relationship between the Euro and the S&P 500.

During extreme market turbulence, many securities and financial instruments—even completely unrelated ones—often move in tandem during a massive flight to safety. Over the past 9 months, there was a full-fledged financial panic, followed by some return of an appetite for risk beginning in March 2009. At first, there was a massive rush out of stocks and into the U.S. dollar. Both the S&P 500 and Euro fell sharply. Once the panic abated and the appetite for risk began to return this spring, capital began flowing back into a broader range of securities and financial instruments. During that time, the S&P 500 and Euro rose in strong tandem, though not as closely as had been the case during the panic.

However, given the past data, over the passage of time, it would be more likely than not that the previously far weaker relationship would begin to reassert itself as the special circumstances behind the recent strong co-movements would no longer be relevant. Already, there are early hints that the relationship is now weakening. Although the r2 between the Euro and S&P 500 has averaged 0.732 over the past year (July 1, 2008-June 30, 2009), it has faded somewhat to 0.663 for the first six months of 2009 and to 0.509 since March 15.

Therefore, if one is looking for hints as to the possible direction of the S&P 500, one should look for developments beyond the Euro to support such a move. Over the longer haul, relying largely on the Euro could be potentially hazardous given the weak medium-term correlation.

&&

Wednesday, July 8, 2009

Credit Card Charge-offs Could Reach 8%-10%

Yesterday, CNBC reported:

Soaring U.S. unemployment and a shrinking economy drove delinquencies on credit card debt and home equity loans to all-time highs in the first quarter as a record number of cash-strapped consumers fell behind on their bills.

The latest data indicate that credit card charge-offs, which stood at 7.49% in the First Quarter of 2009 will likely rise further.


Moreover, if the experience with the previous two recessions is reasonably representative, a peak quarterly charge-off rate of 8% to 10% is possible.

If one examines the experience with the past two recessions, one finds the following:

• The quarterly credit card charge-off rate reached a higher peak in the 2001 recession than the 1990-91 recession, despite a milder contraction in peak-to-trough real GDP.

• The quarterly credit card charge-off rate peaked 4 quarters after the 1990-91 recession ended and 1 quarter after the 2001 recession concluded. The 1990-91 recession was triggered, in part, by a housing bust that encompassed 1989-1994. Considering that the current recession was precipitated by the collapse of a massive housing bubble, a delayed peak akin to the 1990-91 recession is probably more likely than not.

• The amount of personal-sector debt relative to personal-sector liquid assets at the start of a recession appears to have some bearing on the magnitude of the peak credit card charge-off rate. Personal-sector indebtedness relative to liquid assets was markedly higher in 2001 than in 1990. In other words, declining credit quality likely explains the higher peak charge-off rate for the 2001 recession, even as the loss of economic output was markedly smaller than during the 1990-91 recession.

• The amount of personal-sector debt relative to total personal-sector assets mattered less. The need for liquidity and reality that non-liquid assets are difficult to convert into cash during financial market turmoil possibly helps explain the apparently weaker link tying personal-sector debt with total personal-sector assets than the relationship of personal-sector debt with personal sector liquid assets.


That the current recession is the worst of the post-World War II period with a 3.1% decline in real GDP through the First Quarter and the unemployment rate has reached 9.5%, which is well above the peak figures for the 1990-91 and 2001 recessions, argues for a higher quarterly peak charge-off rate than occurred during either of those earlier recessions. Even worse, the ongoing recession unfolded at a time when the personal sector had even higher debt relative to its liquid assets than it did during either of the previous two recessions. As a result, the quarterly credit card charge-off rate is likely to continue to climb in coming months and a peak figure in the 8% to 10% range is likely.

In turn, that development will add to the stresses currently impacting the nation’s weakened financial system. Those additional stresses could culminate in numerous additional bank failures. In addition, increased financial system fragility could lead to a delayed and/or slower and weaker rebound in economic growth than would otherwise be the case.

&&

Tuesday, July 7, 2009

History is the Vital Starting Point for Sound Risk Management

In an opinion piece published in The Washington Post yesterday, the newspaper’s columnist Robert J. Samuelson decried economists’ lack of attention to history. He wrote:

By and large, most economists don't care much about history. Introductory college textbooks spend little, if any, time exploring business cycles of the 19th century. The emphasis is on "principles of economics" (the title of many basic texts), as if most endure forever. Economists focused on constructing elegant, mathematical models…

But often, the models' assumptions depart so radically from reality that the conclusions become useless. Someone who studies history becomes humble in the face of the ceaseless changes and capricious mixing of motives.


In the context of the recent housing bubble that collapsed in the middle of 2006, and produced a severe credit crunch, banking crisis, and sharp synchronized recessions in many parts of the world in its wake, Samuelson’s piece is an important work. What happened is not a novel event. It has been a recurring theme in the long narrative of financial and economic history. So long as human nature remains relatively constant, it will remain a recurring theme.

In general, the rise of asset bubbles—whether in stocks, commodities, or real estate—results from a confluence of human nature, innovation, and easy credit. Even as the specific attributes of various bubbles differ, the pattern of events in which bubbles rise and then collapse is a familiar one. Rationalizations of a “new era” in which advanced technology, management breakthroughs, or sophisticated quantitative models have somehow tamed the business cycle and rendered asset price crashes largely extinct are little more than delusions. In fact, such explanations are a telling symptom that the kind of euphoria that feeds an unsustainable asset price boom has infected market psychology. In such an environment optimism runs wild, blinding investors, lenders, and borrowers to marketplace risk.

In the opening of Benjamin Graham's and David Dodd’s classic work Security Analysis, Graham and Dodd wrote the following of the 1927-33 period that witnessed the U.S. stock market crash and, in its aftermath, the Great Depression:

It can hardly be said that the past six years have taught us anything about speculation that was not known before. Even though the last bull and bear markets have been unexampled in recent history as regards both magnitude and duration, at bottom the experience of speculators was no different from that in all previous market cycles… That enormous profits should have turned into still more colossal losses, that new theories should have been developed and later discredited, that unlimited optimism should have been succeeded by the deepest despair are all in strict accord with age-old tradition.

Three principles found in Graham’s and Dodd’s seminal book are particularly relevant today.

Principle 1: “Investment is by nature not an exact science.”

The idea that financial engineering could yield precise mathematical models that would all but eliminate risk and/or ensure attractive returns on investment is little more than folly. Models are representations. They are simplifications of highly complex phenomena. They do not adequately capture the role of human behavior. Their underlying assumptions do not give sufficient weight to episodes of irrationality. As a result, they cannot provide anything close to prescience, even if they provide an illusion of safety from risk.

Principle 2: "Undervaluations caused by neglect or prejudice may persist for an inconveniently long time, and the same applies to inflated prices caused by overenthusiasm or artificial stimulants."

The efficient markets theory notwithstanding, the historical record demonstrates that asset prices do not always remain anchored to fundamentals. Asymmetric information, among other factors, can lead to significant pricing issues. History also reveals that the departure of asset prices from underlying fundamentals can be both substantial and prolonged.

Principle 3: "…if past experience is any guide, the current critical attitude of the investor is not likely to persist; and in the next period of prosperity and plethora of funds for security purchases, the public will once again exhibit its ingrained tendency to forgive, and particularly to forget, the sins committed against it in the past."

This tendency to forget, or in Graham’s words “forgive,” is regular feature of human nature. Lessons from the past, standards of risk management, and a general sense of prudence all erode during booms. Euphoria entices borrowers, lenders, and investors to push the frontiers of risk in an aggressive pursuit of the last dollar of marginal profits. The scramble for market share trumps discretion. When easy credit is added to the herd-like rush for marginal profits, a full-blown asset bubble can rapidly materialize.

In an especially prescient piece written in December 2004, Morgan Stanley's chief economist Stephen Roach explained:

Nearly five years after the bursting of the equity bubble, America has done it again. This time, it is the housing bubble. But this speculative excess may be the cruelest bubble of all—and has already led to a sharp compression of national saving, a record current account deficit and an ominous overhang of personal indebtedness. The U.S. was fortunate in avoiding the perils of a post-bubble carnage in 2000-2001. It may not be so lucky this time...

While it is only a few years since the bursting of the equity bubble, memories of that speculative excess have already dimmed…


In sum, effective risk management requires a strong understanding of the historical record, market structure and evolution of that structure over time. A firm grasp of the historical record is a necessary starting point for building such an analytical framework. Without it, risk management cannot be effective.

&&

Monday, July 6, 2009

Will China's Central Bank Deploy Monetary Policy Against Asset Price Inflation?

On Saturday, Xia Bin, who heads the financial institute at the State Council Development and Research Center suggested that China’s central bank signal its commitment to a stable money supply in order to prevent an outbreak of asset price inflation. Xia’s call for a broader definition of the objectives of monetary policy is not new.

Since at least 1993, the International Monetary Fund (IMF) has argued that central banks should apply a broader definition to prices than the current consumption and production-based measures they currently employ. In 2000, Henry Kaufman, one of the United States’ leading private economists, wrote, “There is no mandate at the present time for any central bank to take into consideration financial asset prices explicitly in the formation of monetary policy. Nevertheless, the bubbling in the American financial market is an untenable situation.”

Arguments in favor of a broader set of price measures include:

• Capital flows that rush into assets are not picked up by conventional measures of inflation. In the past, sudden and signficant capital inflows have had a destabilizing macroeconomic impact and have precipitated a number of financial crises.

• Excessive asset price inflation can touch off a self-reinforcing situation in which an asset bubble develops.

• Asset bubble growth can crowd out saving. With asset prices rising rapidly, the “wealth effect,” can create disincentives for saving. In fact, that is what happened in the run-up of the recent U.S. housing bubble. Personal saving fell from 5.7% of disposable income in the First Quarter of 1995 to -0.7% of disposable income in the Third Quarter of 2005. Moreover, from the First Quarter of 2005 through the First Quarter of 2008, personal saving averaged just over 0.5% of disposable income.

• Reflecting the decline in personal saving was the onset of a “financial accelerator” effect. During the 1990s, personal consumption accounted for 67.5% of real GDP. During the 2000s, personal consumption had increased to 70.6% of real GDP. Since 2005, personal consumption has averaged 71.2% of real GDP. It was the rise in personal consumption that accounted for much of the growth in real GDP that occurred in the 2000-2007 period. During the 1990s, real GDP expanded an average of 3.1% per year. Non-consumption related items of real GDP rose 2.8% per year. In contrast, during the 2000-2007 timeframe, real GDP grew by 2.5% per year, but the non-consumption items increased by just 1.0% per year.

• All bubbles eventually collapse. When equities, commodities, or real estate bubbles pop, they can result in significant macroeconomic damage.

• Real estate bubbles are particularly hazardous given the amount of debt involved. The collapse of real estate bubbles can create financial system fragility, and frequently a financial sector crisis that can take years to heal. Such a crisis can lead to a severe credit crunch. In turn, the increasing grip of a credit crunch can produce a significant and prolonged recession. The ongoing synchronized global recessions provide an illustration of the dangers of a housing bubble.

The major issue involved in pursuing a broader definition of monetary policy concerns whether central banks can detect formative asset bubbles. In 1999, then Federal Reserve Chairman Alan Greenspan spoke on that issue. He explained that asset bubbles can lead to economic disruptions, but cautioned that they are very difficult to detect and that preempting asset bubbles would require the central bank’s making a judgment that runs counter to the collective decision making of millions of market participants. He stated:

History tells us that sharp abruptly, most often with little advance notice. These reversals can be self-reinforcing processes that can compress sizable adjustments into a very short time period. Panic market reactions are characterized by dramatic shifts in behavior to minimize short-term losses. Claims on far-distant future values are discounted to insignificance. What is so intriguing is that this type of behavior has characterized human interaction with little appreciable difference over the generations…

We can readily describe this process, but to date, economists have been unable to anticipate sharp reversals in confidence… To anticipate a bubble about to burst requires the forecast of a plunge in the prices of assets previously set by the judgments of millions of investors…


Chairman Greenspan’s concerns aside, history has provided a reasonably good guide that could be used as a starting point for determining when asset valuations are rising to levels that are disconnected from economic fundamentals. By indexing asset prices to growth in nominal GDP, a central bank could be alerted for situations where asset prices begin to sharply diverge from economic growth.

That has been the pattern with past asset bubbles. In the years leading to the 1929 stock market crash, stock prices (as measured by the Dow Jones Industrials) suddenly surged wildly higher relative to nominal economic growth.


The same pattern reasserted itself with respect to housing prices (as measured by the seasonally-adjusted Case-Shiller 10-city index, as that index goes back prior to 2000) and mortgage debt (home and multifamily residential mortgages).


In the case of the 1929 stock market crash, during 1927 stock valuations rose to 30% or more above cumulative growth in nominal GDP since 1922. By the end of the year, the Dow Jones Industrials’ increase was almost 60% above the level implied by nominal GDP growth.

With respect to the U.S. housing bubble, as indexed to 1995 valuations, mortgage debt reached that threshold in 2002 and housing prices attained that level a year later. In 2003, mortgage debt had grown more than 40% faster than nominal GDP and in 2004 home prices reached that figure.

What is clear in both cases is that asset valuations were rapidly diverging from economic growth. That is a signature of an “upward panic” or euphoria where market psychology increasingly trumps fundamental factors. In both cases, there was a 1½- to 2½-year window of notice that asset bubble formation was underway.

Perhaps tighter monetary policy might have cut short the expansion of the two asset bubbles. Perhaps the economic fallout in the wake of their premature collapse would have been less than ultimately resulted on account of their having been smaller than when they finally collapsed. That is all speculative.

What will be interesting is to see whether China’s central bank actually steers its monetary policy toward a more comprehensive objective that includes reducing the risk of asset price inflation. Even more important, it will be interesting to see whether that monetary policy approach proves effective in the longer-run.

&&

Friday, July 3, 2009

Failed Banks: A Snapshot

Yesterday, the Federal Deposit Insurance Corporation (FDIC) closed seven additional banks. That brought the number of closed banks this year to 52.

The assets held by the 80 failed banks presently amount to $413.8 billion. In addition, the International Monetary Fund (IMF) projects that writedowns of assets originated in the United States will amount to $2.7 trillion, most of which will be borne by financial institutions. As a result, dozens of additional banks could fail over the next 12-18 months.

A closer look at the failed institutions on the FDIC’s failed bank list reveals:

• The majority of failed banks are small- or medium-sized institutions holding assets of less than $1 billion.

• A disproportionate share of the failed banks is clustered in states in which the real estate market has suffered price declines of 40% or more or in states adjacent to those having such markets.

Size of Failed Banks: In the macroeconomic environment following the collapse of the nation’s housing bubble, which commenced during Summer 2006, 80 banks have failed to date.

If one defines a small bank as having less than $100 million in assets, a medium-sized bank as having $100 million to $999.9 million in assets, a large bank as holding $1 billion to $9.9 billion in assets, and a very large bank as having $10 billion or more in assets, one finds that small- or medium-sized banks account for 80% of failures to date. 60% of failed banks have been medium-sized financial institutions.


The median figure for assets held by the failed banks is presently $295 million. The smallest failed bank was Metropolitan Savings Bank with $15.8 million in assets. The largest was Washington Mutual Bank with $307 billion in assets.

Geographic Concentration of Failed Banks: Bank failure has clustered in a small number of states. Three states—California, Georgia, and Illinois—account for almost 50% of bank failures to date. Five states—California, Florida, Georgia, Illinois, and Nevada account for just over 60% of bank failures to date.


Through July 2, 23 states (46%) had one or more bank failures, while 27 (54%) had yet to record a bank failure. However, extraordinary federal assistance to such giant banks as Citibank and Bank of America, among others, may have limited a more widespread incidence of bank failures.

Data from the S&P/Case-Shiller Home Price Indices reveal that the clustering of failed banks has generally occurred in states with real estate markets that have experienced especially sharp price declines or adjacent states. Through April 2009, the seasonally-adjusted Case-Shiller 10-City Index has fallen 33.1% and the broader 20-City Index has declined by 32.0%. In a number of markets, real estate prices have fallen more than 40% from their peak. Select market date relevant to the five states that have seen a disproportionate incidence of bank failures follows:

Atlanta: 21.5%
Chicago: 26.8%
Detroit: 44.4%
Las Vegas: 51.8%
Los Angeles: 40.9%
Miami: 47.8%
San Diego: 42.2%
San Francisco: 45.6%
Tampa: 40.9%

The Georgia cluster may largely be the result of the decline in key sectors of Florida’s real estate market. Moreover, Georgia’s banks may have been hit harder than Florida’s on account of their persistently thinner cash holdings. The FDIC’s latest data showed that on March 31, 2009, cash accounted for 6.0% of assets in Florida’s banks and 4.5% of assets in Georgia’s banks. A year earlier, those figures were 3.3% and 2.4% respectively. Excessive derivatives exposures very likely contributed. In terms of a share of assets, Georgia's banks had more than 100 times the derivative exposure of Florida's financial institutions in both March 2008 and March 2009. In fact, in the March 2009 data, the derivatives positions held by Georgia's banks came to 106% of their assets.

The Illinois cluster of bank failures may be resulting from a combination of a weak, but not severely depressed, real estate market in Chicago and the severe manufacturing dislocations that are ongoing in the Great Lakes region. Reflecting the severity of the problems plaguing the region's manufacturing sector, the mean unemployment rate for Illinois, Indiana, Michigan, and Ohio was 11.4% in May. Nonetheless, Michigan has experienced far fewer bank failures than Illinois. Derivatives exposure may explain the difference. As a share of assets, Illinois banks had 3.7 times the derivative exposure as their Michigan counterparts in March 2008. In the most recent FDIC data, Illinois banks still had double the derivative exposure as Michigan's banks.

&&

Thursday, July 2, 2009

Unemployment Rate and Duration of Unemployment Increase in June

The Bureau of Labor Statistics’ Employment Situation Report for June 2009 revealed that the nation lost another 467,000 jobs during the month. At the same time, the unemployment rate ticked up to 9.5%. That is its highest figure since August 1983. Given historical experience following the end of post-World War II recessions and the underlying dynamics associated with the current recession, the unemployment rate will likely to rise through the rest of this year before peaking some time next year.

Three snippets from the Employment Situation Report follow.

A 9.5% Unemployment Rate:The unemployment rate reached 9.5% on what appears to be an all but inevitable march to 10% and higher. A departure of 155,000 persons from the labor force somewhat mitigated the rise in June’s unemployment rate. Had those persons remained in the labor force, the monthly unemployment rate would likely have approached or reached 9.6%.

A Dramatic Lengthening of the Median Duration of Unemployment:
In June, the median duration of unemployment rose 20% from 14.9 weeks to 17.9 weeks. That data was presaged in The Conference Board’s June 2009 consumer confidence survey in which the percentage of respondents stating that jobs were “hard to find” increased from 43.9% to 44.8%. June’s increase follows on the heels of a 19% increase in the median duration of unemployment in May. For the second quarter, the median duration of unemployment rose 59.8%. At the same time, the number of people unemployed for 27 weeks or longer increased 37.7%.

Should those trends persist, there is a risk that the recent stabilization of real personal consumption expenditures could be undermined, especially if households intensify their efforts to save. In addition, increases in the charge-off and delinquency rates on residential real estate loans and credit card balances could persist. In turn, those developments could delay or weaken any near-term economic recovery.

Another Dip in the Civilian Labor Force:
Barring a more robust economic recovery than appears likely at this time, the civilian labor force as a percentage of the civilian noninstitutional population aged 16 and older is likely to average below 66.0% for the first time since 1988. That could be an indication of a structural component to the unemployment situation. Were those people to return to the labor force, that development would push the unemployment rate higher. For example, using the June 2009 data, a civilian labor force that came to 66.0% of the civilian noninstitutional population would be 606,000 higher than the reported figure. If all those additional persons were unemployed at the onset and had to look for work, the unemployment rate would have been 9.9% instead of 9.5%. Following the onset of an economic recovery, one can expect a gradual recovery in the civilian labor force as some reenter the civilian labor force. In turn, that development will provide some additional stickiness to the unemployment rate.

Conclusion:
The most recent unemployment data suggests that significant risks that could delay or undermine a near-term economic recovery persist. The major transmission mechanisms for a playing out of those risks would be through weaker real personal consumption expenditures and a further erosion in residential real estate and consumer credit payments. The dramatic lengthening in the median duration of unemployment, growth in the number of those unemployed for 27 weeks or longer, and decreases in the civilian labor force as a share of the civilian noninstitutional population hint at an emerging structural component to the rising unemployment rate. With the financial services and automobile manufacturing sectors likely to comprise a smaller share of the overall economy than they did in the closing years of the housing bubble that collapsed in 2007, some increase in the structural unemployment rate appears more likely than not. Future data will determine whether a larger structural component leads to a higher average rate of unemployment than had been the case during the past 20 years.

&&