Friday, August 28, 2009

Bank Failure Snapshot

This evening, the FDIC announced the failure of Baltimore-based Bradford Bank. Bradford is the 82nd bank to fail this year. Since the housing bubble burst, 110 banks have failed. Total assets for those failed banks amount to $465 billion.

Some quick statistics follow:


In addition, three states account for 51 bank failures or 46% of the total to date:

Georgia: 24
Illinois: 14
California: 13

In sum, a quick snapshot reveals:

• The overwhelming majority (79%) of failed banks are small or medium-sized banks.
• The incidence of bank failures has increased markedly during the summer, with July and August accounting for 45% of this year’s failed banks.
• Bank failures have clustered in select states.

&&

Thursday, August 27, 2009

Basel Committee on Banking Supervision Issues Principles for Financial Instrument Accounting Standards

Today, the Basel Committee on Banking Supervision issued a set of principles aimed at guiding the International Accounting Standards Board (IASB) in addressing issues concerning the fair value of financial assets.

Based on the principles, a new accounting standard should:

• reflect the need for earlier recognition of loan losses to ensure robust provisions;
• recognize that fair value is not effective when markets become dislocated or are illiquid.
• permit reclassifications from the fair value to the amortized cost category; which should be allowed in rare circumstances following the occurrence of events having clearly led to a change in the business model;
• promote a level playing field across jurisdictions.

The Basel Committee also noted:

To address particular concerns about procyclicality, the new standards should provide for valuation adjustments to avoid misstatement of both initial and subsequent profit and loss recognition when there is significant valuation uncertainty. Moreover, loan loss provisions should be robust and based on sound methodologies that reflect expected credit losses in the banks’ existing loan portfolio over the life of the portfolio.

&&

Wednesday, August 26, 2009

Seniors’ Health Care Bill of Rights Fails to Satisfy Key Criteria for Credible Health Reform

As outlined in previous blog entries, arguably the most important criteria any credible health care reform initiative would need to satisfy are:

• The initiative would need to be budget-neutral.
• The reform would need to materially slow the annual growth in national health care expenditures.
• The legislation would need to provide a mechanism that significantly reduces the number of uninsured persons.

At the conclusion of its Chapter IV Consultations with the United States, the International Monetary Fund (IMF) noted, in part:

Directors underscored that addressing soaring entitlement costs remains the critical medium-term fiscal challenge… [T]he ultimate package should include substantial measures to reduce health care costs over the longer term, while aiming at budget neutrality in the short term. Directors underscored that the impact of cost control measures will need to be carefully monitored, and that additional measures should be taken promptly as needed.

To date, the Congressional Budget Office (CBO) has found that emerging reform proposals are not budget neutral and they do not bring about a material reduction in the rate at which national health care expenditures have been growing.

On August 24, 2009, Republican National Committee Chairman Michael Steele unveiled a “Seniors’ Health Care Bill of Rights” as an alternative to emerging Congressional packages. Accompanying the concept was an op-ed piece published in that day’s edition of The Washington Post. Together, the conceptual outline and op-ed piece offer a sketch of broader alternative health care reform ideas that are beginning to emerge. However, as was the case with the Congressional initiatives, the alternative ideas also fail to meet the criteria set forth at the beginning of this blog entry.

A closer look at the Steele concept relevant to the aforementioned criteria follows:

Budget Neutrality: In the op-ed piece, Steele writes, “We also believe that any health-care reform should be fully paid for, but not funded on the backs of our nation's senior citizens.” The conceptual outline offers no specific spending reductions or tax increases that would finance health care reform. Consistent with Republican Party principles, tax hikes are likely to be off the table. Therefore, implicit in the concept is the possibility that all spending reductions for health care reform would need to be taken from discretionary spending or that health care reform would have to be shelved altogether.

The former possibility is unlikely to fully finance health care reform that dramatically reduces the incidence of insured persons. As the Steele concept leaves Medicare on auto-pilot and rules out benefit reductions, the rising costs of Medicare could devour an increasing share of discretionary spending, leaving little or nothing for financing any sustainable health care reform initiative. Furthermore, political consensus to achieve increasingly deep discretionary spending cuts is highly unlikely over the longer-term, even as the magnitude of necessary discretionary budget reductions under the Steele approach would grow. Yet, even if health care reform is canceled, the need for health care reform, particularly as the incidence of uninsured persons persists and excess rise in national health care expenditures continues, would grow more urgent.

Slowing the Excess Rise in National Health Care Expenditures: The concept would rule out cuts in Medicare spending. No mention is made about slowing the growth of Medicare spending either. In contrast, even as the Clinton Administration and Republican-led Congress struggled over Medicare reform during the mid-1990s, both sides were in agreement that the rate at which Medicare spending was growing needed to be slowed. Behind the rise in Medicare spending is the slowly shifting demographic mix and health care inflation. Unless health care inflation is tamed—and increasing health industry productivity and focusing on rising hospital-related costs, which have been the principal driver of medical cost inflation could be essential to that task—Medicare expenditures will continue to increase faster than the economy grows. In the long-run, that is a fiscally unsustainable situation.

Significant Reduction in the Incidence of Uninsured Persons: The concept unveiled by Steele is intended to be a starting point for health care reform. It does not address the measures or mechanisms that would be offered to reduce the incidence of uninsured persons.

In sum, even as Steele asserts, “Republicans want reform that should, first, do no harm,” a failure to address Medicare’s long-term fiscal imbalances, which depends in large part on slowing the annual growth in national health expenditures, will inflict growing damage to the nation’s long-term fiscal outlook. Already, the perpetual horizon unfunded liability associated with Medicare amounts to $85.6 trillion. According to Dallas Federal Reserve President Richard Fisher, 97% of discretionary spending, which includes national defense and education spending, would need to be eliminated to finance the nation’s long-term fiscal imbalances associated with Social Security and Medicare. No such stark decision would be politically-feasible. Hence, far from doing “no harm,” a failure to grapple with the fundamental issue of rising health expenditures, which all but certainly will require a mix of revenue increases and benefit reductions, would do great harm.

&&

Tuesday, August 25, 2009

IMF Research Director Outlines Challenges to Sustaining a Global Recovery

Recently, International Monetary Fund (IMF) Economic Counsellor and Director of Research Olivier Blanchard opined that a global economic recovery had commenced, but that sustaining it could require “delicate rebalancing” during which public fiscal stimulus spending is phased out and private demand replaces public demand, and during which large trade imbalances that had previously persisted moderate. In his assessment, Blanchard highlighted supply-side issues, demand-side issues, and risks associated with a failure to rebalance effectively.

A summary of those issues follows:

Supply-Side Issues:
• Partly dysfunctional financial systems in the advanced countries.
• Capital flows to developing countries that decreased may take a few years to fully recover.
• In nearly all countries, the costs of the crisis have exacerbated the fiscal burden and tax hikes may be necessary.

Demand-Side Issues:
• A return of economic growth in 2009 may not be sufficiently strong to reduce unemployment leading to a peak in the unemployment rate in 2010.
• Initial growth will depend mainly on inventory rebuilding and the fiscal stimulus, not private consumption and fixed investment spending. When the fiscal stimulus is unwound and inventory rebuilding is completed, rebalancing will be required to sustain economic growth.

Risks Associated With A Failure to Rebalance Effectively:
• An anemic U.S. recovery.
• Possible efforts to extend the fiscal stimulus. Premature phasing out of the stimulus would undermine economic growth. Extension of the stimulus could lead to concerns about U.S. debt, sparking large capital outflows from the U.S. and a potentially disorderly decline in the U.S. dollar. In turn, that additional instability or uncertainty concerning such instability could derail an economic recovery.

&&

Monday, August 24, 2009

Bernanke at Jackson Hole: 1999 Paper Remains Relevant

At the Kansas City Federal Reserve’s annual economic symposium at Jackson Hole, Wyoming, Federal Reserve Chairman Ben Bernanke provided a sketch of last year’s financial panic, laid out an account on how the contagion rippled through the financial system, discussed the importance of good liquidity management for the financial sector, and reaffirmed the central bank’s role as a lender of last resort. Noteworthy as that address was, the paper he and Mark Gertler presented at the 1999 symposium remains relevant for some of the lessons it provides.

Some highlights follow:

• Two possible sources of “non-fundamental” fluctuations in asset prices involve “poor regulatory practice” and “imperfect rationality on the part of investors.” There is evidence that financial liberalization that led to poor regulatory practices led to asset price booms in Japan in the 1980s, Scandinavia in the 1990s, among other places. Often financial liberalization led to large capital inflows. Research by Charles Kindleberger revealed that a large proportion of such inflows was allocated to financial investments, touching off a rapid rise in asset prices.

• Problems arise when financial liberalization is not coordinated with the regulatory safety net. Examples of the regulatory safety net include bank deposit insurance and a central bank’s lender-of-last-resort commitments. In such cases, excessive risk-taking can unfold. Bernanke and Gertler explained, “If liberalization gives additional power to private lenders and borrowers while retaining government guarantees of liabilities, excessive risk-taking and speculation will follow, leading, in many cases, to asset-price booms.” Bernanke and Gertler added that this development characterized “reasonably” the S&L crisis in the U.S., the financial crisis in Japan following the collapse of its real estate and stock market bubbles, and the Asian financial crisis, among others.

• Asset prices have an impact on the real economy. The most important connection between asset prices and the real economy is through the balance sheet channel. Cash flows and balance sheet strength are important determinants of agents’ lending and borrowing capacity. The balance sheet channel helps explain the “financial accelerator” effect under which macroeconomic activity strengthens during a rapid rise in asset prices. It also helps explain the slowdown, and sometimes, debt-deflation mechanism, that develops following a sharp contraction in asset prices.

As a caveat, it should be noted that there is significant disagreement on the issue of whether monetary policy should respond aggressively to potential asset bubbles, particularly real estate bubbles that involve large amounts of leverage. The Bernanke-Gertler paper argued against intervention when it came to stock market bubbles. It did not address real estate bubbles. The paper asserted that when monetary policy aggressively targets consumer and producer inflation, “whether policy also responds independently to stock prices is not of great consequence.” In contrast, in recent years, the International Monetary Fund has increasingly called for greater consideration of asset prices in the rubric of inflation measurements.

Nevertheless, in the end, the Bernanke-Gertler paper offers policy makers some important guidance in developing a post-financial crisis regulatory framework. Most importantly, policy makers will need to ensure that the regulatory regime is compatible with the regulatory safety net. As a corollary, policy makers will need to take steps to ensure that the extraordinary intervention during the financial crisis will not breed the kind of moral hazard that could fuel a fresh wave of excessive risk-taking in the near- or medium-term. One key to such an approach would entail addressing the “too big to fail” issue. If that issue is resolved, then the extraordinary intervention would be perceived as a rare exception, not the norm of what could be expected should a future crisis erupt.

For now, even as prospective regulatory reforms have been introduced, the overall process is still in its early stages. For that reason, the 1999 Bernanke-Gertler paper can offer policy makers some valuable guidance as they pursue regulatory reform.

&&

Friday, August 21, 2009

Initial Weekly Unemployment Claims Rise to 576,000

Yesterday, the Department of Labor reported that initial weekly unemployment claims rose to 576,000. That marked the second consecutive weekly increase. The figure came in above both the consensus forecast of 550,000 and the highest estimate among economists of 559,000. In addition, the four-week moving average for initial weekly unemployment claims rose 4,250 to 570,000.

Although it is still a little too soon to suggest that a fresh increase is now underway, past recessions have typically seen initial weekly unemployment claims rise anew for a time before finally falling off to levels compatible with net job creation.

Given past historic experience, not to mention the dynamics associated with the current recession, the following still appears likely:

• A period during which weekly unemployment claims rise anew, perhaps approaching or reaching 600,000 during one or two weeks.
• A persistence of initial weekly unemployment claims remaining at or above 500,000, for most of the rest of this year, though some fluctuations below 500,000 are possible.
• A low possibility that weekly unemployment claims could fall to 450,000 toward the end of the year.
• A continuing rise in the national unemployment rate from 9.4% through the rest of this year, though minor fluctuations with some small dips are also possible ahead of the peak unemployment rate.
&&

Thursday, August 20, 2009

Despite Analyst’s Opinion, Inflation Fears Are Not Behind the Current Oil Price

On August 19, 2009, CNBC reported:

The price of oil could slump toward $20 as the fundamentals supporting it are still extremely weak and its currently only being held up by fear of inflation, Johannes Benigni, managing director at JBC Energy, told CNBC.

"People are scared of inflation, that's why they are buying oil and other commodities…," Benigni said.


Although the price of crude oil may be running above levels implied by fundamentals such as global consumption and global crude oil stocks, and such a situation would be consistent with the tendency for markets to overshoot, survey and swaps data indicate that inflation concerns are not the explanation for current oil prices.

• The median expected increase in prices over the July 2009-July 2010 timeframe in the University of Michigan survey of consumers was 2.9%. That was down from the previous month’s figure of 3.1%.

• U.S. Dollar Inflation Zero Coupon securities also paint a picture of low, tame inflation. The 1-year, 2-year, and 5-year figures on August 19 were 1.23%, 1.10%, and 1.56% respectively. The 10-year figure was 2.44%. That data suggests that investors are expecting inflation to remain contained in the near- and medium-term, and generally near levels compatible with price stability a decade out.

Finally, if one examines recent news stories concerning recent oil market developments, market psychology rooted in expectations for an improving global economic outlook may be an important driver of crude oil prices. Three recent examples from The Wall Street Journal:

July 24, 2009 edition: “Although the economy is still in a slump, investors were galvanized by a third monthly increase in existing-home sales in June…”

July 31, 2009 edition: “Crude-oil futures shot up, reversing sharp losses from the prior session as rising confidence in an economic recovery displaced concerns about weak oil demand.”

August 4, 2009 edition: “Crude-oil prices settled at a six-week high, as the dollar dropped to its lowest level against the euro this year amid optimism about the outlook for the world economy.”

&&

Wednesday, August 19, 2009

Oil Market Update: U.S. Crude Oil Stocks Fall Sharply

Today, the U.S. Energy Information Administration (EIA) reported that U.S. crude oil inventories plunged 8.4 million barrels to 343.6 million barrels for the four-week period ended August 14.

Overall, the decline in inventories is in line with expectations laid out in the August 6 blog entry. Highlights from that entry were:

U.S. oil consumption has continued to follow broad seasonal patterns albeit with a noticeably sharper falloff between winter heating season and the summer driving season.

If one transposes this year’s trends relative to the 10-year base, the recent uptick in oil inventories was not too surprising. However, assuming that this year’s dynamics remain relatively constant, oil inventories are not likely to rise significantly in coming weeks. Instead, the more normal pattern of falling inventories until sometime in mid- to late-September should resume.

The dynamics that have prevailed so far this year would suggest an initial peak near 350 million barrels before a fresh decline in inventories commences.


Aside from rising oil consumption (now 18.995 million barrels per day, the highest figure since the four-week period ended March 20, 2009 when consumption averaged 19.112 million barrels per day), a substantial drop in oil imports likely produced the sharp decline in inventories. The four-week period ended August 14, saw imports average 9.662 million barrels per day. The prior four-week period had average daily imports of 10.087 million barrels.

Overall, my thinking remains essentially unchanged from August 6. In my opinion, oil inventories should ultimately fall to just below 340 million barrels in coming weeks. A 1-2- standard deviation move below the patterns that have prevailed this year would bring oil inventories to as low as 324 million to 331 million barrels before the autumnal rise in crude stocks begins some time in September.

&&

Scholes: Bring Transparency to Banks’ Illiquid Assets

On Tuesday, Nobel Prize winning economist Myron Scholes asserted that banks should provide fair value estimates for their illiquid assets. To do so, he urged that banks shift more of their illiquid assets to exchanges and expand mark-to-market accounting. Currently, the Financial Accounting Standards Board is considering whether to expand its fair-value rules to bank loans.

If implemented, Scholes’ recommendation would constitute an important step toward greater transparency, more timely reporting, and more credible information. In theory, armed with improved assessments of the value of a financial institution’s assets, investors would be able to make better capital allocation decisions. In turn, better capital allocation decision making should lead to improved macroeconomic outcomes over the long-run.

In his book, The Roaring Nineties (W. W. Norton & Company, 2003), Columbia University economics professor Joseph Stiglitz explained the linkage between capital allocation and macroeconomic outcomes as follows:

When share prices reflect bad information, resources are likely to be badly deployed. In the late nineties, they were very badly deployed. Rising prices say, “invest more.” The fast-rising prices of tech and telecommunications stocks led to an enormous overhang of investment in those sectors of the economy. That overhang, in turn, was partly responsible for the long downturn that began in late 2000. And it all started with ill-advised accounting practices…

For a market economy to function well, all the participants must have confidence in it. Investors and potential investors need to believe that there is a level playing field, with accurate information, rather than a rigged game in which insiders are bound to win.


Additional measures that could reduce the problem of asymmetric information—information that is not possessed at the same time by all market participants—would include:

• Expensing of stock options. Ultimately, stock options have a dilutive impact on shareholder wealth. Expensing would allow shareholders to better assess the costs and benefits of such options.

• A dramatic reduction of off-balance sheet items. The practice of shifting potentially significant items off the balance sheet tends to make it more difficult for investors to reasonably assess the risk associated with a given firm. With such items having no visible impact on the net worth of a company, management could also be more willing to take larger risks than if the items were reported on the balance sheet.

• A robust strengthening of the conservatism constraint. In other words, when the value of a balance sheet or income statement item is difficult to determine, the firm should adopt the practice that is least likely to overstate income or asset valuations.

• Full disclosure of investment positions. Such disclosure would entail providing gross positions, in addition to netting them out. Henry Kaufman, one of the nation’s leading private sector economists explained in his On Money And Markets: A Wall Street Memoir (McGraw-Hill, 2000), “At times of turmoil, market participants can’t rely on netting plus positions and minus positions with clients. Thus, gross exposures may be the true exposures.”

&&

Tuesday, August 18, 2009

Fed Lending Survey: Large Banks First to Ease Lending Standards

On Monday, the Federal Reserve issued its July 2009 Senior Loan Officer Opinion Survey. Among other things, the survey revealed:

• U.S. banks indicated that they continued to tighten terms of loans to businesses and households.

• U.S. banks suggested that falling demand for loans and deteriorating credit quality were behind a decline in commercial and industrial lending during the Second Quarter.

• U.S. banks pointed to industry-specific problems as a reason for tightening lending standards.

If one compares the July 2009 findings with the earlier April 2009 survey, one finds that a number of large banks somewhat eased their lending standards. No medium- or small-sized banks eased their lending standards.


The current situation in which a number of large banks have led the way in becoming the first institutions to somewhat ease their lending standards may have to do with differing perspectives on risk. The larger institutions may have greater ability to differentiate among customers. They may possess a greater degree of confidence in their ability to weather the continuing fallout of the ongoing recession given their larger resources, greater access to financial markets, and possible perceptions of available federal assistance. The profile of failed banks may also be driving the early divergence in lending posture.

Through August 14, 2009, 77 banks have failed this year. Almost 85% of those banks were small- or medium-sized institutions having assets of less than $1 billion. The median total assets held by banks that failed this year amounted to $271.8 billion.


Following the 2001 recession, small- and medium-sized banks were the first to ease somewhat in August 2002. However, it was not until 2003 that a growing number of banks, led by large institutions, began easing their lending standards. If the past recession offers any insights, most banks are more likely than not to hold lending standards steady or even tighten somewhat over the next 6 months or longer.

&&

Monday, August 17, 2009

Hospitals are the Principal Driver of Health Care Inflation

In Friday’s discussion, I noted that statistical data revealed that the largest share of increased national health expenditures can be attributed to medical price inflation. At the same time, the smallest share can be attributed to value added.

As a result, a closer look at health care inflation is in order. Data provided by the U.S. Bureau of Labor Statistics reveals:

• Medical price inflation is not broad-based. Instead, a single sector is the major contributor. Both during the 2000-08 timeframe and during the very recent July 2008-July 2009 period, hospital and related services saw, by far, the largest price hikes.

• Professional services e.g., physician services, saw a slowdown in price increases during the July 2008-July 2009 timeframe, even as consumer prices overall fell.

The following tables provide a snapshot of medical price changes and overall changes in consumer prices.


In sum, the key to taming medical price inflation likely depends on a fundamental restructuring of the nation’s hospitals so that the hospitals become more sensitive to overall economic developments and increase their overall productivity. Such a restructuring would entail states and localities making it easier for poorly-run hospitals to fail, better run hospitals to expand across state borders, and international hospitals to enter the U.S. market, among other things.

&&

Friday, August 14, 2009

Low Value-Added May Be Helping Drive Rising Health Expenditures

The August 13, 2009 edition of The Washington Post reported:

Democrats say it will be hard to push a reform bill through Congress unless it reduces projected spending on health care and begins to bring the federal debt under control…

“It's not good enough that it's just paid for; it actually has to start driving long-term costs down,” said Sen. Mark Warner (D-Va.), one of nine freshman Democrats who last month urged Senate leaders to pay more attention to controlling federal health spending in this era of “exploding debt and deficits.”


This latest assessment reflects the notion that credible health care reform legislation will need to address the chronic situation at which national health expenditures have been rising faster than nominal GDP.

To take a closer look at the excess of growth in national health expenditures and nominal economic growth, from 2000 through 2008 national health expenditures increased from $1.353 trillion to $2.379 trillion. That is an average increase of 7.3% per year. During that same period, nominal GDP rose at an average rate of 5.3% per year. Had national health expenditures grown at the rate the economy grew, national health expenditures would have been $327 billion less than they were in 2008. Cumulative savings from 2000 through 2008 would have amounted to $1.735 trillion.


Looking ahead, the 2008 Annual Report of the Medicare Trustees projected that nominal GDP would expand at an annual rate of 4.9% from 2008 through 2018. In contrast, according to the Centers for Medicare and Medicaid Services forecast that national health expenditures would increase by an average of 6.2% per year. If those predictions play out, national health expenditures would be running $530 billion more in 2018 than if they increased at the rate the economy grew. Were national health expenditures to grow at the rate of nominal GDP during that timeframe, cumulative savings would amount to $1.719 trillion.

One of the major problems confronting policy makers is the absence of health care industry productivity data. Although the Bureau of Labor Statistics provides labor and output productivity for a large number of industries, that data does not include health services. In the absence of such data, it is difficult for policy makers to gain a good understanding of the root of the health expenditures imbalance.

To gain a crude approximation, one must:

• Identify the share of increased expenditures that is due to medical price inflation.

• Identify the share of increased expenditures that is associated with the changing age structure of the U.S. population. In general, older persons have higher per capita health expenditures.

• Identify the share of increased expenditures that is associated with changes in utilization. Increased average consumption of health services boosts national health expenditures.

Once those tasks are completed, it can be assumed that the remaining increase in expenditures results from value added. That is a generous assumption, as myriad inefficiencies could explain at least part of the remaining increase in national health expenditures.

In any case, the 2000-2008 data reveals that the largest share of increased national health expenditures can be attributed to medical price inflation. The smallest share can be attributed to value added.


Overall, from 2000-2008, value added increased at an average of 1.2% per year. During that same period, the nonfarm business sector enjoyed average annual productivity growth of 2.5%. Productivity in the manufacturing sector increased 3.3% per year. As a result, the rough approximation of health industry value added hints that abnormally low productivity could be playing a role in helping drive medical price inflation.

If, in fact, that is the case, policy makers will need to consider provisions in the health reform legislation that would:

• Increase industry competition. Increasing industry competition would entail examining trade barriers that preclude greater competition from abroad, price protections that preserve arbitrage situations in pharmaceutical prices, and state-based regulatory barriers that limit competition.

• Improved education. Over time, improved medical education and training can lead to better outcomes.

• Encourage investment in technology and improved facility management practices. Technology and improved management can reduce inefficiencies over time.

• Address procurement practices. In general, when emerging technologies are purchased in their infancy, the cost-benefit ratio of such technologies is lower than when such technologies have evolved and advanced. Better procurement would take into consider cost curves associated with changing/emerging technologies.

&&

Thursday, August 13, 2009

Fed Somewhat More Upbeat, Errs on the Side of Caution

Today, the Federal Reserve maintained its 0.00%-0.25% target for the federal funds rate. However, on balance, the Federal Reserve's Federal Open Market Committee (FOMC) was somewhat more upbeat than in June.

Several highlights from the FOMC’s monetary policy statement included:

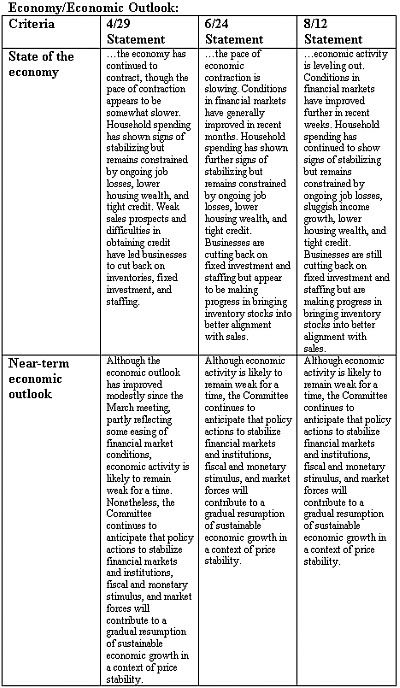
• The FOMC noted that economic activity is "leveling out." In its June 29 statement, the FOMC observed that "the pace of economic contraction is slowing."

• The FOMC reaffirmed its earlier assessment for a "gradual resumption of sustainable economic growth."

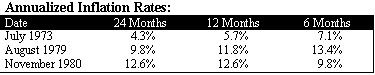
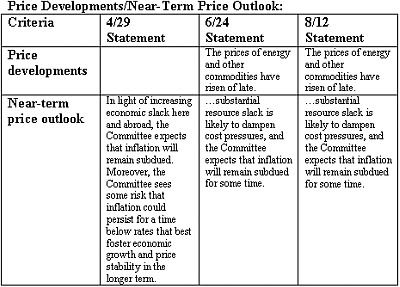
• On the inflation front, the FOMC explained that despite a recent uptick in energy and commodities prices, inflation should remain "subdued for some time."

• In maintaining its current interest rate posture, the FOMC reaffirmed its earlier forecast that "economic conditions are likely to warrant exceptionally low levels of the federal funds rate for an extended period."

• In a prudent move to avoid the risks associated with a premature unwinding of its extraordinary policy measures, the Federal Reserve reaffirmed its asset acquisition parameters. The FOMC also added specificity to its earlier statements, replacing "up to $300 billion of Treasury securities" with "$300 billion of Treasury securities" and "by autumn" with "by the end of October." Previously, the program was set to expire at the end of September and some market pundits had speculated that the Fed would announce an end to its asset purchases.

All said, the Fed acknowledged increasing indications of economic stabilization, but also erred on the side of caution in explaining that it will purchase the full amount of the $300 billion in Treasury securities that it had previously suggested that it could purchase.

Reflecting the strong consensus in the decision, there were no dissents.

Overall, the somewhat more upbeat economic assessment and continuity in monetary policy was consistent with my overall expectations. On August 10, my blog entry outlined my expectations for the FOMC’s August 12 monetary policy statement. A comparison between those expectations and the wording in the FOMC’s statement follows:

Expectation: That the pace of economic contraction has slowed significantly and that economic activity is showing some indications of stabilizing. It may also note some enhancement in economic prospects. That wording will constitute an improvement over the FOMC’s June 24 statement in which it observed that “the pace of economic contraction is slowing.”

Outcome: The FOMC explained, “Information received since the Federal Open Market Committee met in June suggests that economic activity is leveling out.”

Expectation: That the housing market has shown additional signs of stabilizing.

Outcome: The FOMC’s statement made no mention of housing market conditions.

Expectation: Household spending has remained fairly stable, but is constrained by continuing weakness in the labor market.

Outcome: The FOMC explained, “Household spending has continued to show signs of stabilizing but remains constrained by ongoing job losses, sluggish income growth, lower housing wealth, and tight credit.

Expectation: Anticipation that “policy actions to stabilize financial markets and institutions, fiscal and monetary stimulus, and market forces will contribute to a gradual resumption of sustainable economic growth in a context of price stability.”

Outcome: The FOMC predicted that “policy actions to stabilize financial markets and institutions, fiscal and monetary stimulus, and market forces will contribute to a gradual resumption of sustainable economic growth in a context of price stability.”

Expectation: Modest growth in economic activity is likely during the remainder of the year.

Outcome: The FOMC provided no additional commentary on economic growth except that it expected “a gradual resumption of sustainable economic growth.”

Expectation: That inflation will remain “subdued.”

Outcome: The FOMC indicated that “inflation will remain subdued for some time.”

Expectation: The FOMC “will employ all available tools to promote economic recovery and to preserve price stability,” “will continue to evaluate the timing and overall amounts of its purchases of securities in light of the evolving economic outlook and conditions in financial markets,” and that it will monitor “the size and composition of its balance sheet” and make such adjustments as might be warranted.

Outcome: The FOMC reaffirmed all of the above ideas.

Expectation: Economic conditions will “likely warrant exceptionally low levels of the federal funds rate for an extended period.”

Outcome: The FOMC indicated that “economic conditions are likely to warrant exceptionally low levels of the federal funds rate for an extended period.”

Finally for purposes of comparison, the following tables reflect the Fed’s evolving thinking on key criteria from the April 29, June 24, and August 12 monetary policy statements.


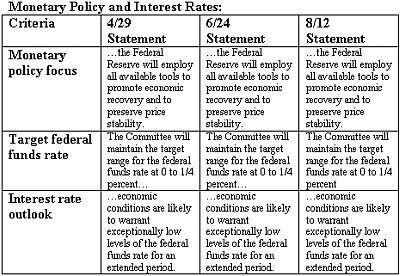
Extraordinary Programs/Fed’s Balance Sheet:
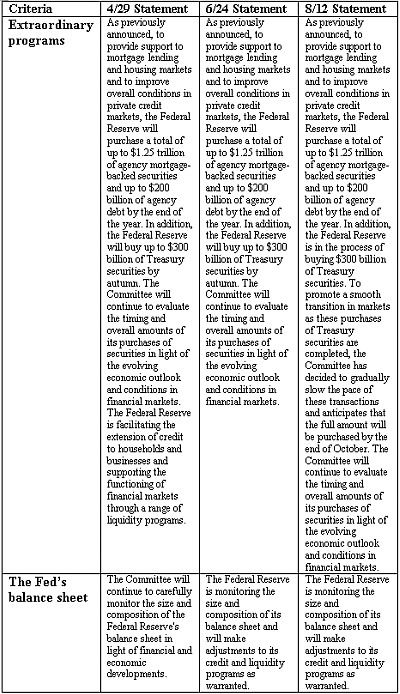

&&

Wednesday, August 12, 2009

Analyst: Fed Could Hike Rates to 7% by Mid-2011

Yesterday, CNBC reported that John Lekas, CEO and portfolio manager of Leader Capital indicated that the Federal Reserve could raise the benchmark federal funds rate to 7% by the Second Quarter in 2011. “We think the Fed will take [interest rates] to almost 7 percent by the second quarter of 2011. That’s based on weak GDP and continuing deterioration of the dollar, which is inflationary.”

Currently, the Federal Reserve’s target rate for the federal funds rate is 0.00% to 0.25%. Since 1971, the Federal Reserve has increased its benchmark rate by 500 or more basis points within two years on three occasions: July 1973, August 1979, and November 1980. In each case, the nation was confronted either by high inflation or rapidly rising inflation.


Despite the enormous fiscal and monetary stimulus that has been applied, during what has been the steepest recession of the post-World War II era, a number of factors suggest that inflation will likely remain relatively tame over the next 1-2 years. Those factors include:

• A relatively high unemployment rate. The high unemployment rate will create sufficient labor market slack so as to avoid any significant increase in wages.

• Financial system weakness. In the wake of the housing bubble and in the face of rising consumer delinquencies and defaults, the nation’s financial system remains under pressure. As a result, credit creation is likely to be less robust than it was during recent decades.

• During U-shaped recoveries, real GDP has averaged 2.1% growth in the first year following the trough in GDP and 3.5% over two years from the trough. Such growth is not likely to trigger a major outbreak of inflation.

• Household deleveraging will likely restrain the growth of personal consumption expenditures. More modest consumption than might otherwise be the case should also dampen inflationary pressures.

• With inflation remaining relatively contained over the next two years, expectations for future inflation should also remain anchored. Typically, expectations for inflation during the year ahead largely reflect inflation that has occurred during the past 6-24 months.

All said, unless significant or rapidly rising inflation materializes over the next two years, the Fed’s post-recession interest rate hikes will likely bring about a gradual increase in rates. Right now, it appears that the case against significant or rapidly rising inflation remains somewhat more likely than the high inflation outcome. Factors that could change that outcome would include a failure by the federal government to develop a credible budget deficit reduction program following the return of sustained economic growth, the inability of the Federal Reserve to wind down its balance sheet once sustained economic growth is underway, the onset of much more rapid economic growth than appears likely, a substantial energy price shock, and/or the adoption of programs that could markedly increase the nation’s structural budget deficits.

&&

Tuesday, August 11, 2009

U-Shaped vs. V-Shaped Recoveries: Some Benchmarks

To establish some benchmarks, one needs to examine the ten prior post-World War II recessions. In those recessions, the mean rebound in real GDP 1 year after the bottom was reached was 4.9%. The median figure was 5.4%.

If one uses a growth rate of more than 1 standard deviation below the mean figure to identify U-shaped recoveries, one can categorize the ten previous recoveries as follows:

U-Shaped Recoveries:
1981-82
1990-91
2001

V-Shaped Recoveries:
1948-49
1953-54
1957-58
1960-61
1969-70
1973-75
1980

For U-shaped recoveries, the mean 1-year growth rate from the recession's bottom was 2.1%. The mean 2-year annualized growth rate was 3.5%. In U-shaped recoveries, the growth rate tended to accelerate after the initial year of growth.


For V-shaped recoveries, the mean 1-year growth rate from the recession's trough was 6.1%. The mean 2-year annualized growth rate, even taking into consideration the rapid onset of the 1981-82 recession, was 5.1%. Excluding that recession, which arguably distorted the 2-year annualized figure, the 1- and 2-year growth rates came to 6.3% and 5.8% respectively. In V-shaped recoveries, the initial year of growth was typically strongest, with the second year seeing robust but somewhat more restrained growth.


The overall growth trajectories for U-shaped recoveries and V-shaped recoveries (all V-shaped ones and those excluding 1980) follows:


In sum, one can reach several rough conclusions:

• During U-shaped recoveries, annualized 1-year and 2-year real GDP growth from the bottom of the preceding recession is less robust than comparable growth during V-shaped recoveries.

• During U-shaped recoveries, real growth tends to accelerate after the initial year of recovery.

• During V-shaped recoveries, real growth typically decelerates following the burst of growth in the initial year, but remains robust during the second year following the economic trough.

&&

Monday, August 10, 2009

FOMC’s August 12 Monetary Policy Statement: No Rate Change, but Somewhat More Upbeat

On Wednesday, August 12, the Federal Reserve’s Federal Open Market Committee (FOMC) will very likely hold the federal funds rate steady in the 0.00% to 0.25% range. Signaling continuity with current interest rate policy, Federal Reserve Chairman Ben Bernanke told the House of Representatives’ Committee on Financial Services on July 21, “The FOMC anticipates that economic conditions are likely to warrant maintaining the federal funds rate at exceptionally low levels for an extended period.”

Nevertheless, the FOMC’s forthcoming policy statement will likely reflect a combination of sentiments that are similar to recent monetary policy statements, along with some subtle changes in wording to reflect the continuing stabilization of the U.S. economy and prospects for modest growth through the rest of 2009. Overall, the statement will be somewhat more upbeat than the prior one, but it is unlikely to contain any hints of upcoming interest rate hikes or concerns about rising inflation.

Overall, one can likely expect the following in the FOMC’s forthcoming monetary policy statement:

• That the pace of economic contraction has slowed significantly and that economic activity is showing some indications of stabilizing. It may also note some enhancement in economic prospects. That wording will constitute an improvement over the FOMC’s June 24 statement in which it observed that “the pace of economic contraction is slowing.”

• That the housing market has shown additional signs of stabilizing.

• Household spending has remained fairly stable, but is constrained by continuing weakness in the labor market.

• Anticipation that “policy actions to stabilize financial markets and institutions, fiscal and monetary stimulus, and market forces will contribute to a gradual resumption of sustainable economic growth in a context of price stability.”

• Modest growth in economic activity is likely during the remainder of the year.

• That inflation will remain “subdued.”

• The FOMC “will employ all available tools to promote economic recovery and to preserve price stability,” “will continue to evaluate the timing and overall amounts of its purchases of securities in light of the evolving economic outlook and conditions in financial markets,” and that it will monitor “the size and composition of its balance sheet” and make such adjustments as might be warranted.

• Economic conditions will “likely warrant exceptionally low levels of the federal funds rate for an extended period.”

&&

Friday, August 7, 2009

Weekly Unemployment Claims Fall and a Brief Look Ahead

Initial weekly unemployment claims fell more than expected to 550,000 for the week ended August 1, 2009. That is well below the 674,000 figure incurred during the week ended March 28, 2009.

To date, the 2007-present recession has seen the following with respect to initial weekly jobless claims:

• Peak initial weekly unemployment claims: 674,000
• Consecutive weeks with initial unemployment claims of 500,000 or more: 30
• Weeks with initial unemployment claims of 500,000 or more: 38
• Consecutive weeks with initial unemployment claims of 600,000 or more: 17
• Weeks with initial unemployment claims of 600,000 or more: 22

Despite the unexpectedly large decline in weekly jobless claims, initial weekly unemployment claims will likely remain at or above 500,000 for most of the rest of this year. If the past three recessions (1981-82, 1990-91, and 2001) are representative, there remains a distinct possibility that weekly unemployment claims could again approach or reach 600,000 at some point before the year is finished. Each of the past three recessions featured a brief period during which weekly unemployment claims rose before renewing a decline from their peak.


All said, looking back at the past, through the rest of the year one could see:

• A period during which weekly unemployment claims rise anew, perhaps approaching or reaching 600,000 during one or two weeks.
• A persistence of initial weekly unemployment claims remaining at or above 500,000, for most of the rest of this year, though some fluctuations below 500,000 are possible.
• A low possibility that weekly unemployment claims could fall to 450,000 toward the end of the year.
• A continuing rise in the national unemployment rate from 9.4% through the rest of this year, though minor fluctuations with some small dips are also possible ahead of the peak unemployment rate.

&&

Thursday, August 6, 2009

U.S. Oil Inventories Rise, But Not Likely to Reach The Peak of Earlier This Year

On Wednesday, the U.S. Energy Information Administration reported that U.S. crude oil stocks rose 1.7 million barrels for the four-week period ended July 31. Typically, crude oil inventories bottom out in mid-September before rising ahead of heating season, though some fluctuations occur along the way.


Reduced oil consumption due to the ongoing recession that has seen real GDP contract 3.9% from its peak through the Second Quarter has led to higher inventories. During the first 31 weeks this year, U.S. oil consumption has averaged 18.9 million barrels per day. That is 5.6% below the figure for the same period last year. In response, U.S. crude oil stocks have averaged 353.7 million barrels for the first 31 weeks this year. That is 15.1% above the average figure for the comparable period last year.

Nonetheless, U.S. oil consumption has continued to follow broad seasonal patterns albeit with a noticeably sharper falloff between winter heating season and the summer driving season.


If one transposes this year’s trends relative to the 10-year base, the recent uptick in oil inventories was not too surprising. However, assuming that this year’s dynamics remain relatively constant, oil inventories are not likely to rise significantly in coming weeks. Instead, the more normal pattern of falling inventories until sometime in mid- to late-September should resume.


The dynamics that have prevailed so far this year would suggest an initial peak near 350 million barrels before a fresh decline in inventories commences. Then, inventories could fall to around 338 million barrels. Afterward, in the run-up to heating season could again lift inventories to near 350 million barrels. If one considers a 1-2-standard deviation move from the patterns that have prevailed this year, one could see oil inventories bottom out in the 324 million to 331 million barrel range. That would be well above last year’s bottom of 290.2 million barrels. On the high-end, a 1-2-standard deviation difference from the patterns that have prevailed this year would suggest a latter-year peak of 357 million to 364 million barrel range. That would be well above last year’s 321.3 million barrel autumnal peak. However, it would be comfortably below the 375.3 million barrel figure reached for the four-week period ended May 1, 2009.

In the end, what is important is not the exact numbers discussed above, as they are merely meant to provide a quick sketch. What is important is that U.S. crude oil inventories are not likely to return to the peaks reached earlier this year unless the ongoing recession suddenly deepens anew. As a result, the kind of buildup in crude oil stocks that would help spark a fresh collapse in oil prices to or below the $33.87 figure reached on December 19, 2008, much less the $20 figure one analyst has forecast, is unlikely.

&&

Wednesday, August 5, 2009

U.S. Could Have Annual Trade Surplus with the United Kingdom

In yesterday’s blog entry, I noted that the median 4-quarter rebound in real GDP following the trough of a recession in the U.S. came to 5.4% during the post-World War II era. In the United Kingdom, the initial growth was typically far more modest. Since 1955, the median rebound in real GDP in the United Kingdom came to 1.4%.


During the three most recent recessions, the initial U.S. rebound has been notably smaller. Given household deleveraging in the U.S., among other factors, real personal consumption expenditures will likely grow more slowly than usual. With real personal consumption expenditures having accounted for 69.9% of real GDP at the start of the current recession, the slow growth in real personal consumption expenditures will likely limit the magnitude of initial U.S. economic growth.

In the United Kingdom, household consumption accounted for a smaller share of GDP. At the onset of the current recession, British consumption accounted for 62.7% of real GDP. Hence, any slowdown in the growth rate of British consumption will likely have a lesser impact on the strength of the initial recovery in the United Kingdom. As a result, the initial recovery may well be pretty close to the median experience since 1955 +/- 1.0%.

Such an outcome could favor a strengthening of the British Pound vis-à-vis the U.S. dollar. As a result, the United States could enjoy an annual trade surplus with the United Kingdom for the first time since 1998.

&&

Tuesday, August 4, 2009

High Household Debt Could Temper the Strength of the Economic Rebound

With the U.S. economy showing increasing signs of stabilizing and the rate of its contraction slowing markedly in the Second Quarter, the question arises as to how vigorous the rebound will be once it gets underway. A look at the 10 earlier post-World War II recessions offers a measure of insight.


In those earlier recessions, the mean change in real personal consumption expenditures and real GDP for the four quarters following the bottoming of real GDP came to 4.4% and 4.9% respectively. The median figures for real GDP were 4.6% and 5.4% respectively. During the last three recessions, both real personal consumption expenditures and real GDP rebounded notably more slowly.

One popular argument that is often heard is that, in general, the sharper the contraction, the stronger the recovery. A regression analysis of the previous post-World War II recessions suggests a very weak relationship. The coefficient of determination for such an outcome is just 0.180. The mean error using the extent of contraction as the independent variable came to 1.5 percentage points with respect to the actual growth of real GDP in the four quarters following the trough.

A broader set of data that used household debt as a percentage of nominal GDP at the beginning of the recession and growth in real personal consumption expenditures during the four quarters following the trough in real GDP as independent variables fared better. The coefficient of determination came to 0.671. In addition, the mean error was 0.9 percentage points.

Although the data set is small, what the data suggests offers some insight into looking ahead to the robustness of the economic recovery following the bottoming of the economy. In particular, the statistical analysis reveals:

• Higher household debt (as a share of nominal GDP) provides a headwind that impedes the vigor of the first four quarters of an economic recovery.

• The magnitude of the increase in real personal consumption expenditures is positively correlated with the magnitude of increase in real GDP.

In fact, on closer inspection, the data suggest that the magnitude of household debt is a potentially important determinant in how strongly real personal consumption expenditures recover. The coefficient of determination between household debt as a percentage of nominal GDP at the start of the recession and rate at which real personal consumption expenditures rise following the bottoming of the economy is 0.423. In other words, the rate at which real personal consumption expenditures increase following the trough of a recession is, in part, a function of household debt.

At the start of the current recession, household debt stood at a staggering 97.9% of GDP. 76.3% of that debt was tied up in mortgages. In contrast, during the 2001 recession, household debt came to 74.7% of GDP and 65.2% of that debt was comprised by mortgages. During the 2001 recession, home prices continued to rise. During the current recession, which was sparked by the collapse of a massive housing bubble, U.S. home prices have fallen 32.0%, as measured by the seasonally-adjusted Case-Shiller Index.

In the wake of the collapsed housing bubble, the household sector has been experiencing deleveraging. Household debt has fallen $158.8 billion. In addition, saving as a percentage of disposable income has risen sharply from a quarterly average of 1.5% of disposable income at the beginning of the recession to 5.2% of disposable income in the Second Quarter.

In sum, the household debt burden is another indication that the upcoming economic recovery will likely be shallower than has been the norm during the post-World War II experience. Given the magnitude of household debt, economic growth in the real GDP of 1.5% to 2.5% over the four quarters following the bottom of the recession is probably more likely than the post-World War II median figure of 5.4%.

&&

Monday, August 3, 2009

Correction

During the 2007-present recession, real personal consumption expenditures have fallen 2.0% from their peak. The blog entry for August 3 erroneously refers to a 1.8% decline.

A Tale of Three Recessions

Last Friday, the Bureau of Economic Analysis released the 2009 Second Quarter GDP data. The latest information showed that the economy contracted by a 1.0% annualized rate and real personal consumption expenditures fell by an annualized 1.2%. To date, the current recession has seen peak-to-trough GDP decline by 3.9%. That is the largest decline of the post-World War II era.

The three biggest recessions during the post-World War II era are the 1973-75, 1981-82, and 2007-present recessions.


In the current recession, real personal consumption expenditures have fallen almost as much as they fell during the 1973-75 recession. With ongoing deleveraging and a rising unemployment rate, an additional decline is possible in the Third Quarter. In addition, real gross private domestic investment has plunged by 32.1% from its previous peak. That is the largest decline during the post-World War II period.


As noted earlier, household deleveraging is likely to place a lid on potential growth in personal consumption. The current recession differs markedly from the two earlier recessions cited above in that household and nonfinancial corporate leverage was substantially greater than it was during the 1973-75 and 1981-82 recessions.


The notably greater nonfinancial corporate debt could dampen a recovery in gross private domestic investment at a time when personal consumption is likely to play a smaller role in the upcoming recovery than in the recent past. In the 1973-75 and 1981-82 recessions, real personal consumption expenditures returned to their pre-recession peak two quarters after bottoming out.


This time around, a less robust recovery in real personal consumption expenditures is likely, even as real personal consumption expenditures accounted for a much larger share of real GDP than during the 1973-75 and 1981-82 recessions. It is plausible that it could take 3 or even 4 quarters from the bottom for real personal consumption expenditures to return to their earlier peak.

That means that gross private domestic investment, a reduction in the nation’s trade deficit, and increased government spending will need to lead the way to a sustainable economic recovery. However, the higher level of corporate indebtedness suggests that the recovery in gross private domestic investment will likely be a gradual one. Furthermore, given the high level of mortgage debt, the residential construction component of real gross private domestic investment, which has fallen 56.9% from its peak, is also likely to be slow. As a result of those two factors, the 1973-75 experience in which it took 8 quarters from its trough for real gross private domestic investment to return to its earlier peak is probably more likely than the 1981-82 experience in which it took just 4 quarters. An even lengthier recovery period is plausible.

A continued unwinding of the U.S. trade deficit should help strengthen the recovery, once it gets underway. However, the overall impact of this unwinding will likely be modest, if a global recovery pushes up the price of crude oil over the next 12-24 months.

Given the federal government’s unprecedented budget deficits, the recent massive expansion in federal spending is not likely to be sustained. Maintaining the aggressive fiscal posture could undermine investor confidence in the U.S. government, driving down the foreign exchange rate of the U.S. dollar, and generating a rise in long-term interest rates that could impede economic activity. In addition, with the IMF recently highlighting the medium-term fiscal challenges facing the U.S., namely the need to establish a credible fiscal consolidation strategy, efforts to curb the growth of federal expenditures could get underway in a year or two.

In sum, restrained growth in personal consumption, a slow recovery in gross private domestic investment, and limits to an expansionary fiscal posture will likely cap the rate at which the economy can grow. In turn, a slower growth trajectory could weaken revenue growth for the federal government, making it even more necessary for its developing and implementing a credible fiscal consolidation strategy. Given that challenge, it is quite likely that a combination of discretionary spending reductions and revenue increases will be deployed in any effort to cut the nation’s budget deficit. The extent of the tax hikes could have a material impact on economic growth.

&&